Summary
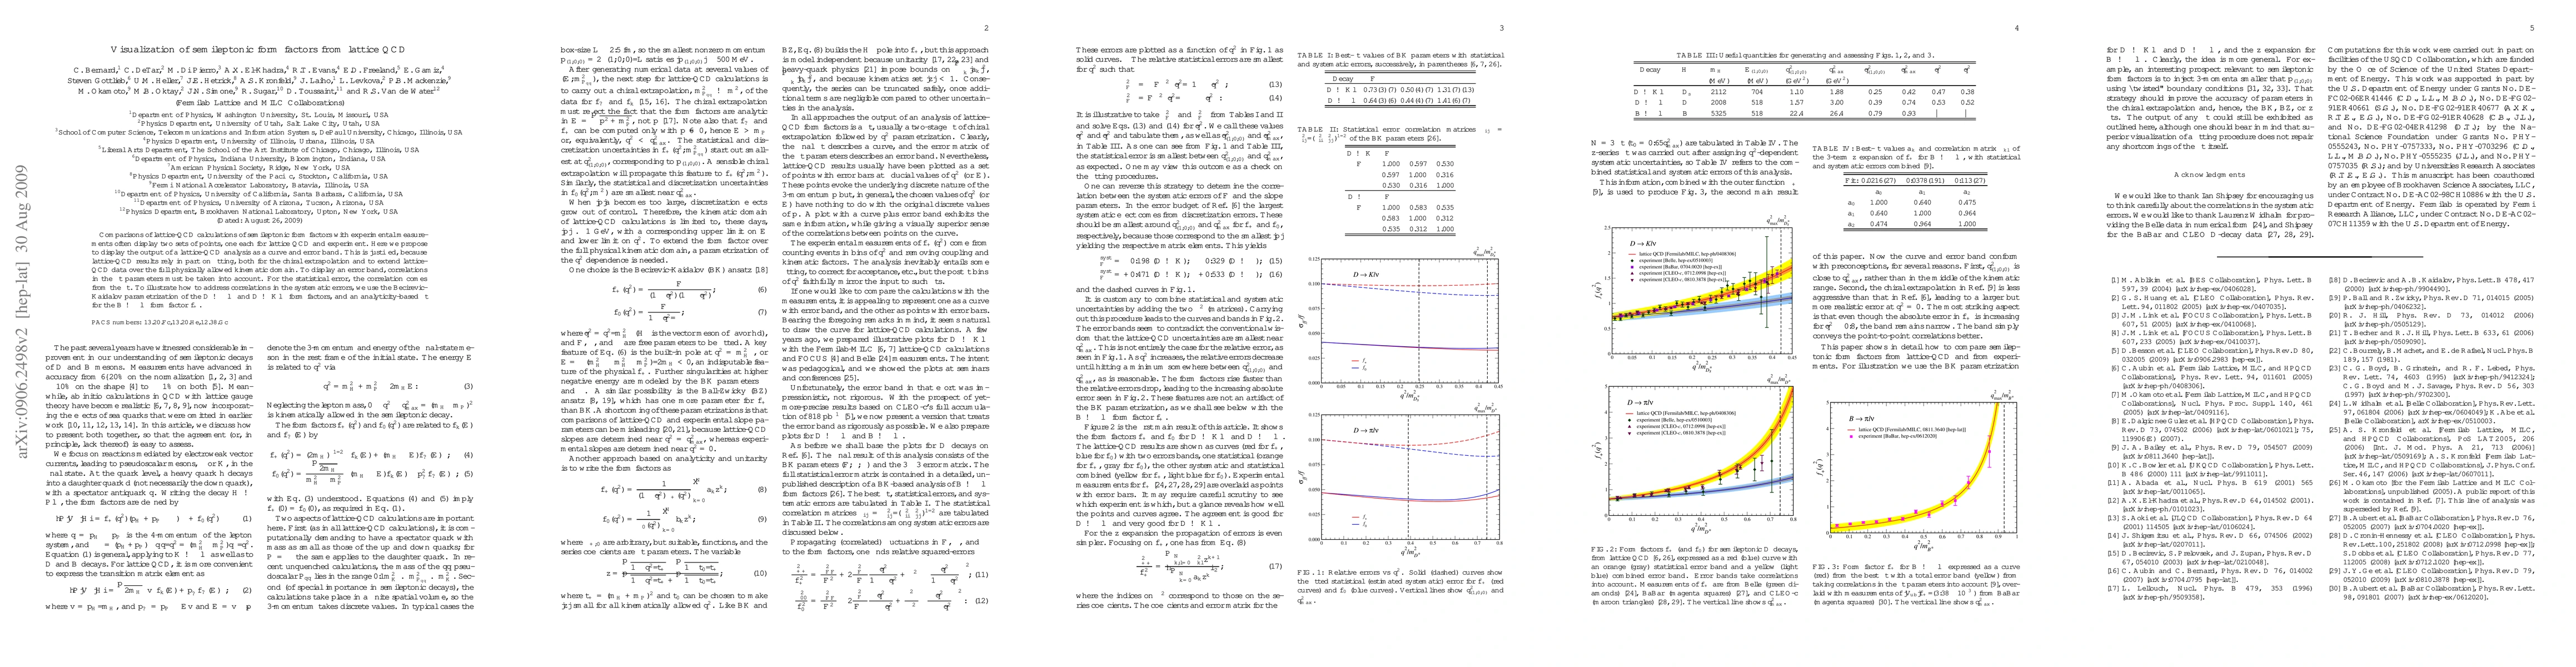
Comparisons of lattice-QCD calculations of semileptonic form factors with experimental measurements often display two sets of points, one each for lattice QCD and experiment. Here we propose to display the output of a lattice-QCD analysis as a curve and error band. This is justified, because lattice-QCD results rely in part on fitting, both for the chiral extrapolation and to extend lattice-QCD data over the full physically allowed kinematic domain. To display an error band, correlations in the fit parameters must be taken into account. For the statistical error, the correlation comes from the fit. To illustrate how to address correlations in the systematic errors, we use the Becirevic-Kaidalov parametrization of the D -> pi l nu and D -> K l nu form factors, and a analyticity-based fit for the B -> pi l nu form factor f_+.
AI Key Findings
Get AI-generated insights about this paper's methodology, results, and significance.
Paper Details
PDF Preview
Key Terms
Citation Network
Current paper (gray), citations (green), references (blue)
Display is limited for performance on very large graphs.
Similar Papers
Found 4 papers| Title | Authors | Year | Actions |
|---|
Comments (0)