ArxivLens

Quick Summary:

This paper discusses the establishment of a Software Project Control Center (SPCC) to enhance integrated software project control through systematic visualization of measurement data, providing context-specific insights for stakeholders to improve process and product quality. Practical examples and experiences from implementing SPCCs are also presented.

DOI: 10.1007/978-3-642-02574-7_94
arXiv Id: 1401.1906
Comments: 10 pages. The final publication is available at http://link.springer.com/chapter/10.1007%2F978-3-642-02574-7_94
Report No: Human-Computer Interaction: New Trends, volume 5610 of Lecture Notes in Computer Science, pages 846-855. Springer Berlin Heidelberg, 2009
Date Published: 2014-01-10
Date Updated: 2014-01-10

Categories:

Key Terms (TF-IDF):

software (0.264)
software (0.252)
project (0.249)
project (0.246)
development (0.234)
visualization (0.228)
development (0.226)
systematic (0.220)
systematic (0.213)
oriented (0.205)
support (0.205)
quality (0.198)
support (0.197)
quality (0.196)
oriented (0.195)
control (0.186)
control (0.178)
measurement (0.163)
measurement (0.157)
processes (0.154)
License: http://arxiv.org/licenses/nonexclusive-distrib/1.0/

Summary:

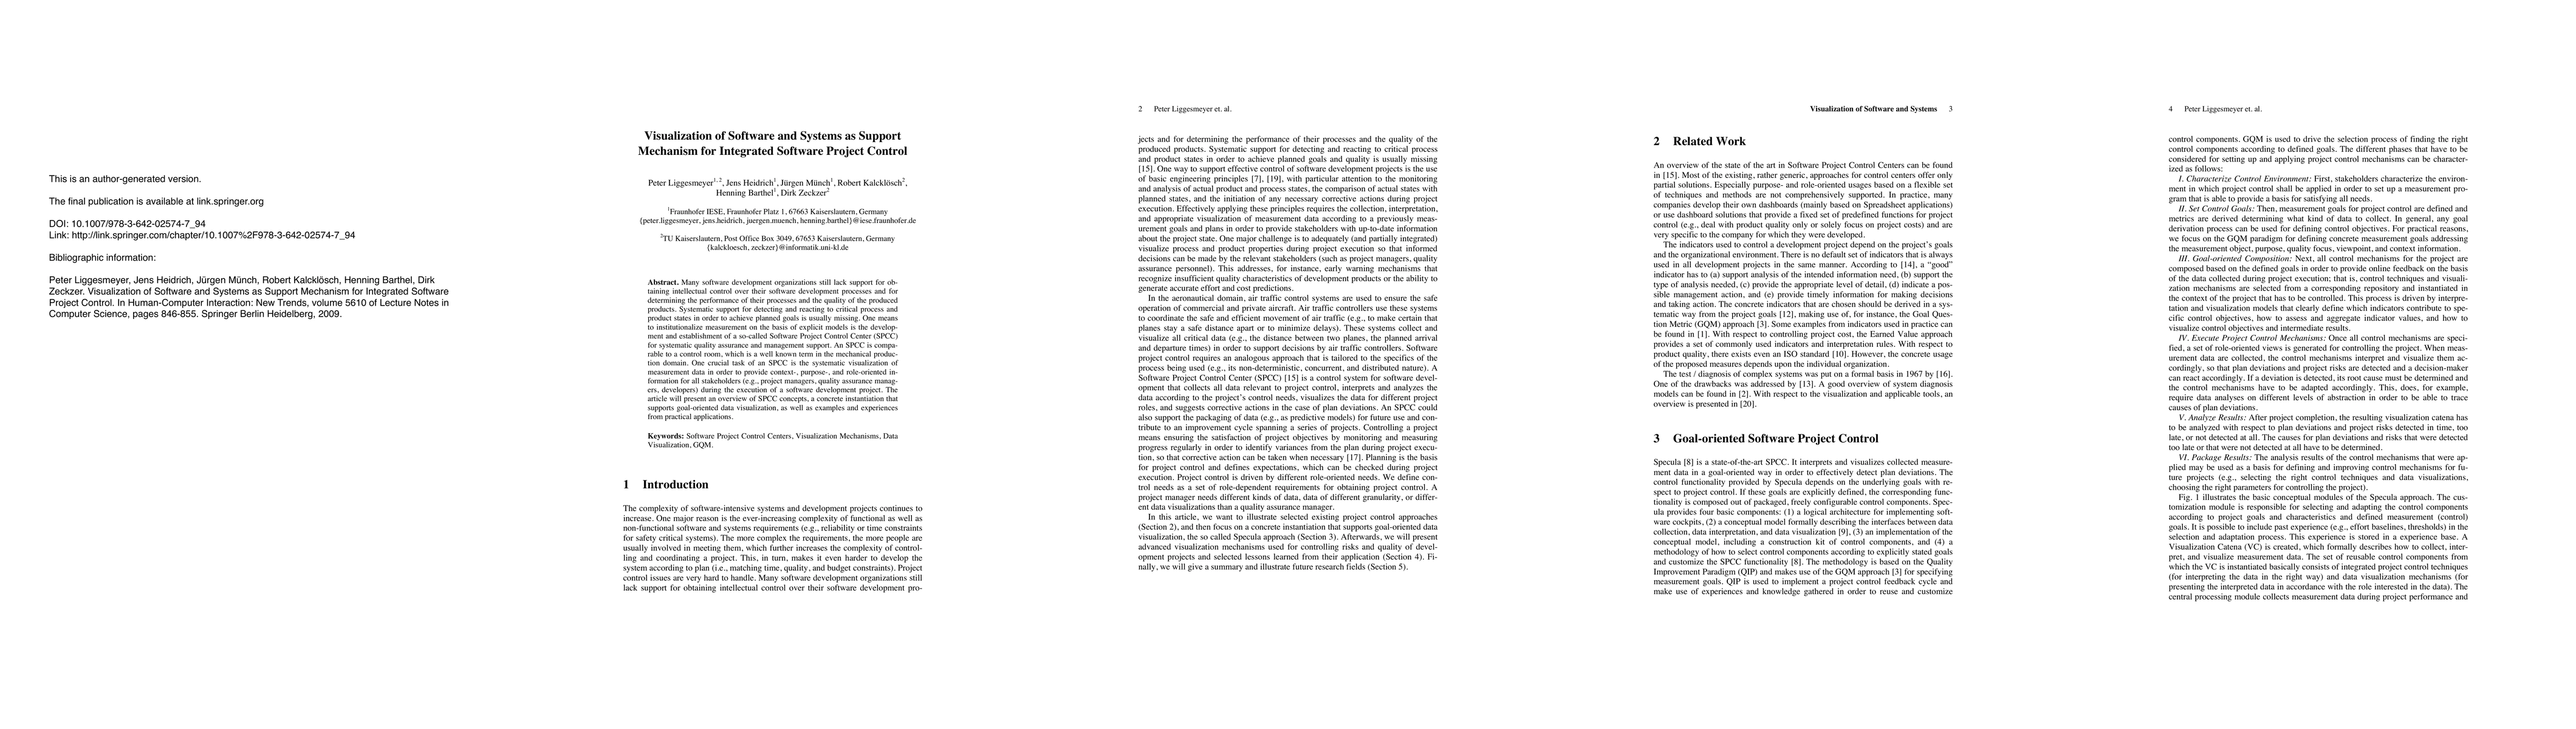
Many software development organizations still lack support for obtaining intellectual control over their software development processes and for determining the performance of their processes and the quality of the produced products. Systematic support for detecting and reacting to critical process and product states in order to achieve planned goals is usually missing. One means to institutionalize measurement on the basis of explicit models is the development and establishment of a so-called Software Project Control Center (SPCC) for systematic quality assurance and management support. An SPCC is comparable to a control room, which is a well known term in the mechanical production domain. One crucial task of an SPCC is the systematic visualization of measurement data in order to provide context-, purpose-, and role-oriented information for all stakeholders (e.g., project managers, quality assurance managers, developers) during the execution of a software development project. The article will present an overview of SPCC concepts, a concrete instantiation that supports goal-oriented data visualization, as well as examples and experiences from practical applications.

Citation & Reference Network Visualization

This graph shows how this paper is connected to other research. The current paper is shown in dark gray, papers that cite it are in green, and papers it references are in blue. You can:

Current Paper
Papers citing this work (Citations)
Papers cited by this work (References)

• Hover over any node to see the paper title

• Click a node to view that paper's details

• Drag nodes to rearrange the graph

• Use the zoom controls (bottom right) to zoom in/out

Citations and References

Title Authors Year Actions
Interactive Rendering of Complex 3D-Treemaps with a Comparative Performance Evaluations
Matthias Trapp, Sebastian Hahn, J. Döllner
2018
View Paper
Systematic Metric Systems Engineering: Reference Architecture and Process Model
Matthias Vianden
2017
View Paper
Continuous Product-Focused Project Monitoring with Trend Patterns and GQM
H. Nakai, Kiyoshi Honda, H. Washizaki, Y. Fukazawa, Ken Asoh, Kazuyoshi Takahashi, Kentarou Ogawa, M. Mori, Takashi Hino, Yosuke Hayakawa, Yasuyuki Tanaka, S. Yamada, Daisuke Miyazaki
2014
View Paper
Initial Industrial Experience of GQM-Based Product-Focused Project Monitoring with Trend Patterns
H. Nakai, Kiyoshi Honda, H. Washizaki, Y. Fukazawa, Ken Asoh, Kazuyoshi Takahashi, Kentarou Ogawa, M. Mori, Takashi Hino, Yosuke Hayakawa, Yasuyuki Tanaka, S. Yamada, Daisuke Miyazaki
2014
View Paper
The Design Space of Implicit Hierarchy Visualization: A Survey
Hans-Jörg Schulz, S. Hadlak, H. Schumann
2011
View Paper
Modular Visualization of Distributed Systems
Gustavo Guevara, Travis Desell, Jason LaPorte, Carlos A. Varela
2011
View Paper
Statische Codemetriken als Bestandteil dreidimensionaler Softwarevisualisierungen
Jan Schilbach
2010
View Paper
Natural Phenomena as Metaphors for Visualization of Trend Data in Interactive Software Maps
Hannes Würfel, Matthias Trapp, Daniel Limberger, J. Döllner
2015
View Paper
Creating the Conveyerl visualisation tool for Erlang programs
Johan Tjelldén, Erik Ylipää, C. Schulte
2012
View Paper
Explorative graph visualization
Hans-Jörg Schulz
2010
View Paper

Comments (0)

This website uses cookies to ensure you get the best experience. Learn more