Visualization of Technical and Tactical Characteristics in Fencing
Publication
Metrics
AI Quick Summary
Researchers developed FencingVis, an interactive visualization system to analyze fencing competition data, revealing tactics and technical characteristics through visualizations of action sequences and tactical flow graphs.
Paper Preview
Abstract
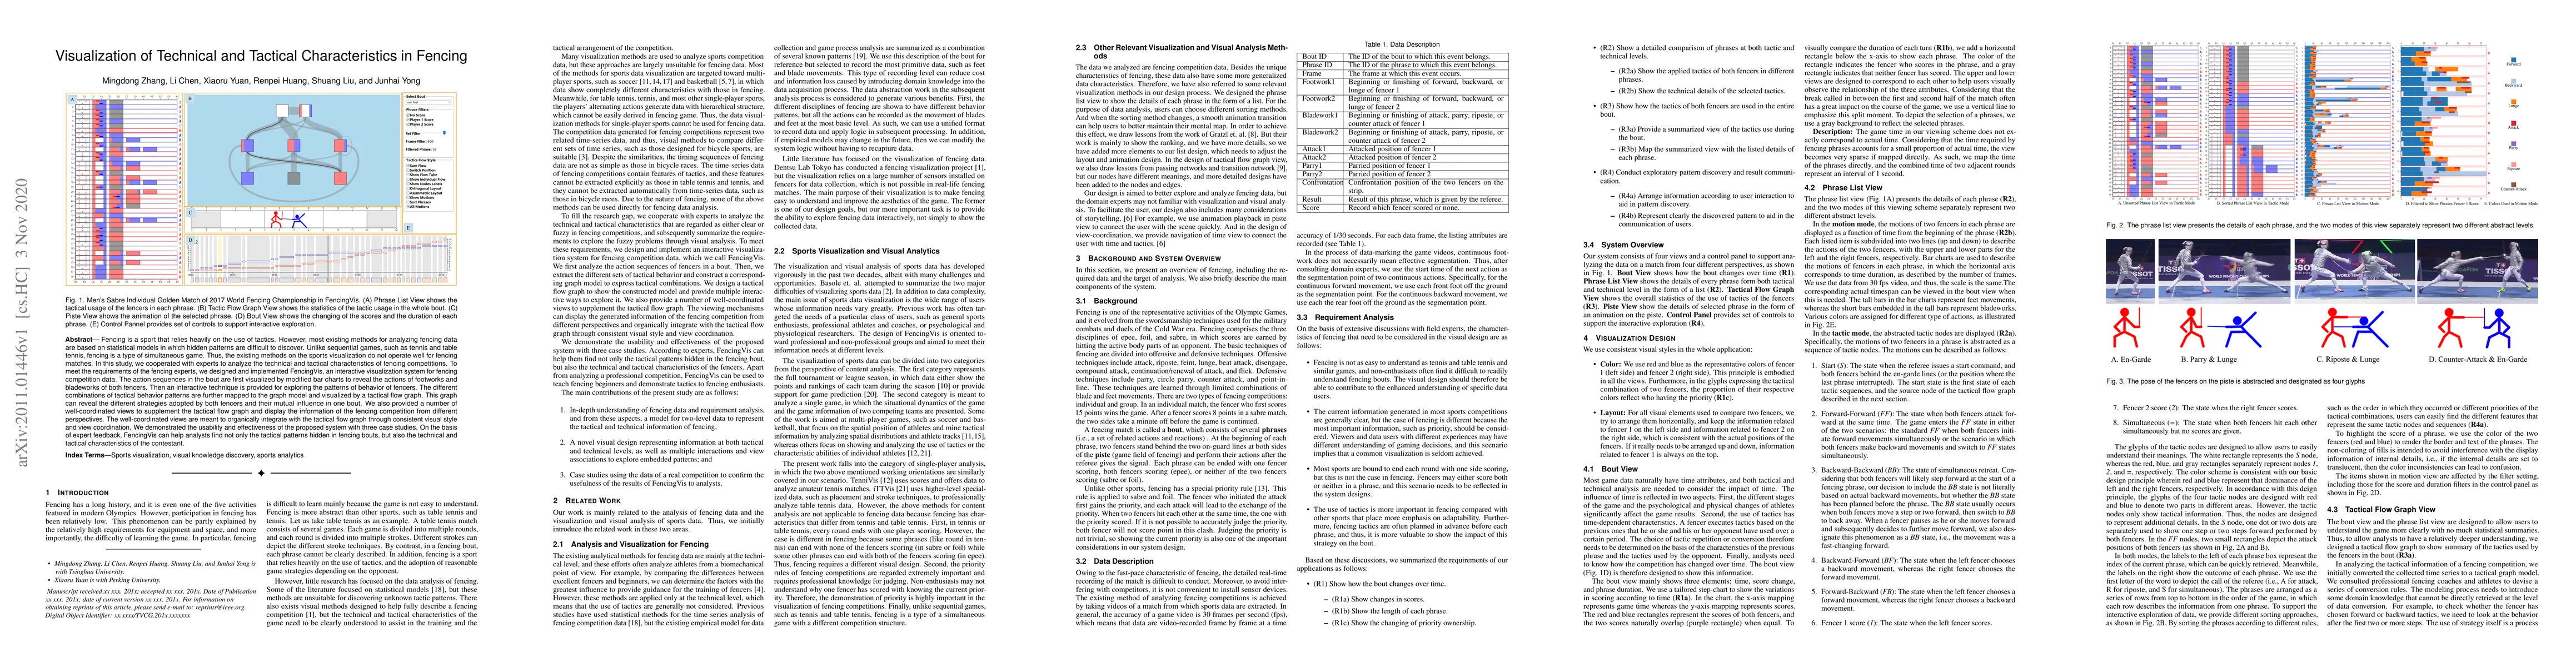
Fencing is a sport that relies heavily on the use of tactics. However, most existing methods for analyzing fencing data are based on statistical models in which hidden patterns are difficult to discover. Unlike sequential games, such as tennis and table tennis, fencing is a type of simultaneous game. Thus, the existing methods on the sports visualization do not operate well for fencing matches. In this study, we cooperated with experts to analyze the technical and tactical characteristics of fencing competitions. To meet the requirements of the fencing experts, we designed and implemented FencingVis, an interactive visualization system for fencing competition data.The action sequences in the bout are first visualized by modified bar charts to reveal the actions of footworks and bladeworks of both fencers. Then an interactive technique is provided for exploring the patterns of behavior of fencers. The different combinations of tactical behavior patterns are further mapped to the graph model and visualized by a tactical flow graph. This graph can reveal the different strategies adopted by both fencers and their mutual influence in one bout. We also provided a number of well-coordinated views to supplement the tactical flow graph and display the information of the fencing competition from different perspectives. The well-coordinated views are meant to organically integrate with the tactical flow graph through consistent visual style and view coordination. We demonstrated the usability and effectiveness of the proposed system with three case studies. On the basis of expert feedback, FencingVis can help analysts find not only the tactical patterns hidden in fencing bouts, but also the technical and tactical characteristics of the contestant.
AI Key Findings
Get AI-generated insights about this paper's methodology, results, significance, and more — seven facets brought into focus.
Impact
Paper Details
Authors
PDF Preview
Key Terms
Citation Network
Current paper (gray), citations (green), references (blue)
Display is limited for performance on very large graphs.
Discussion 0