Summary
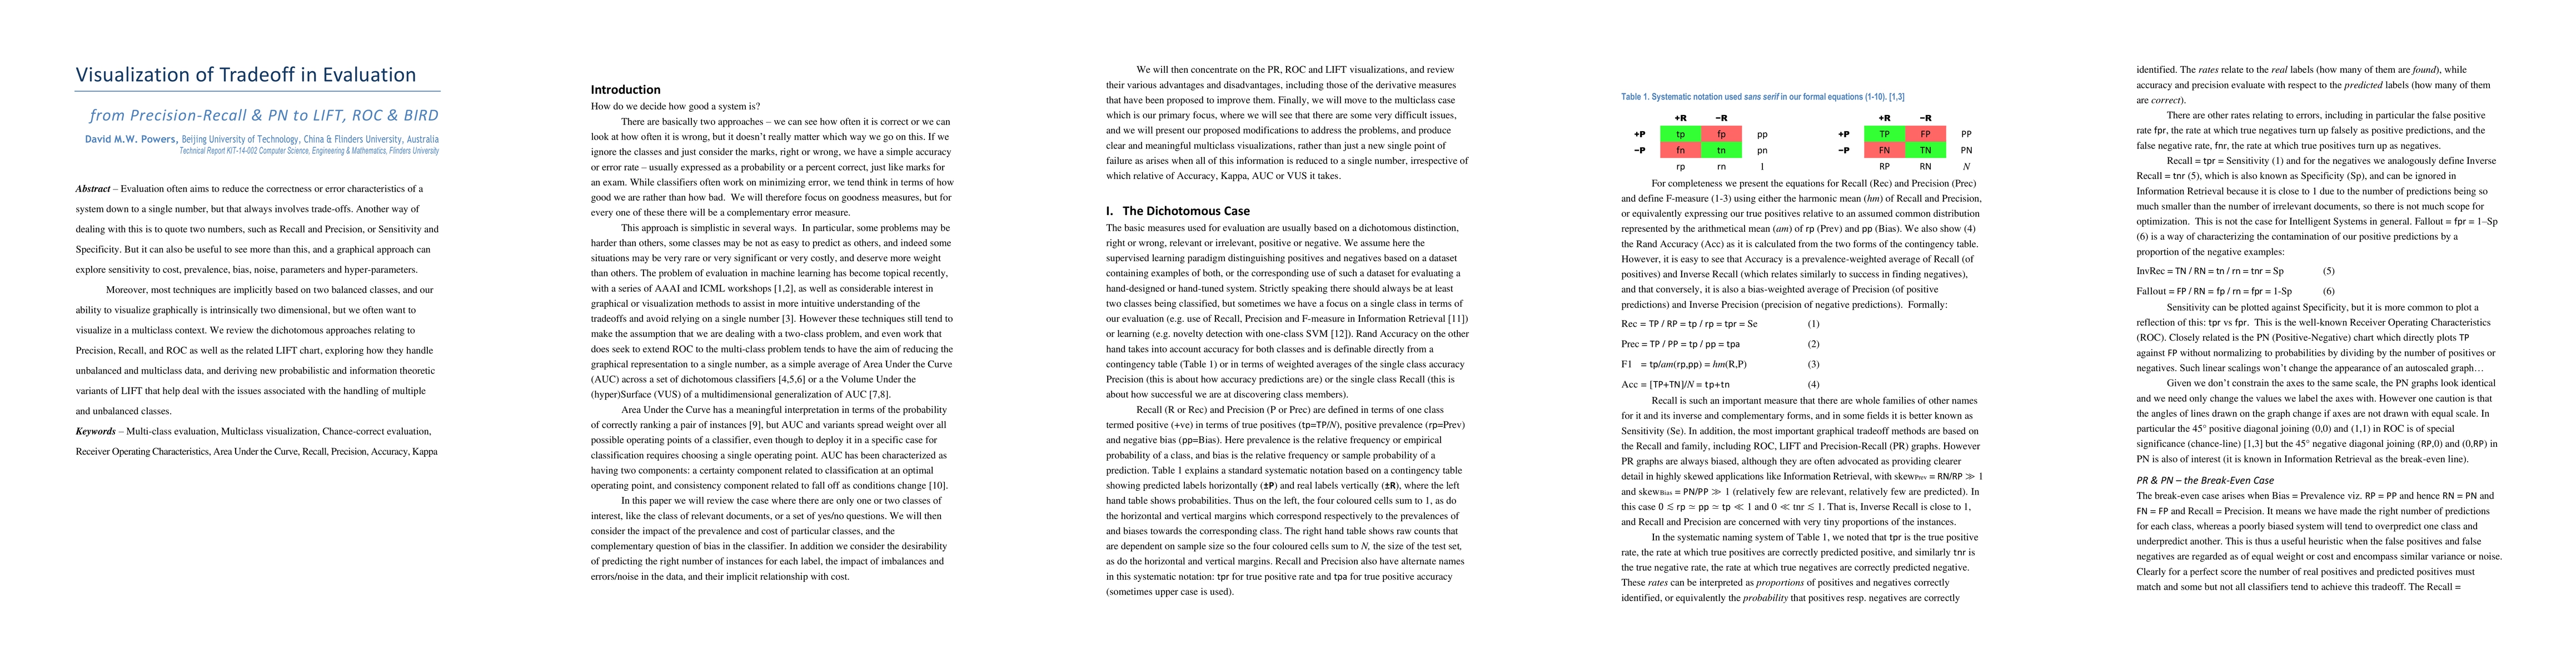
Evaluation often aims to reduce the correctness or error characteristics of a system down to a single number, but that always involves trade-offs. Another way of dealing with this is to quote two numbers, such as Recall and Precision, or Sensitivity and Specificity. But it can also be useful to see more than this, and a graphical approach can explore sensitivity to cost, prevalence, bias, noise, parameters and hyper-parameters. Moreover, most techniques are implicitly based on two balanced classes, and our ability to visualize graphically is intrinsically two dimensional, but we often want to visualize in a multiclass context. We review the dichotomous approaches relating to Precision, Recall, and ROC as well as the related LIFT chart, exploring how they handle unbalanced and multiclass data, and deriving new probabilistic and information theoretic variants of LIFT that help deal with the issues associated with the handling of multiple and unbalanced classes.
AI Key Findings
Get AI-generated insights about this paper's methodology, results, and significance.
Paper Details
PDF Preview
Key Terms
Citation Network
Current paper (gray), citations (green), references (blue)
Display is limited for performance on very large graphs.
Similar Papers
Found 4 papersProbabilistic Precision and Recall Towards Reliable Evaluation of Generative Models
Dogyun Park, Suhyun Kim
| Title | Authors | Year | Actions |
|---|
Comments (0)