Visualization of Unstructured Sports Data -- An Example of Cricket Short Text Commentary
Publication
Metrics
AI Quick Summary
This paper proposes a method to visualize unstructured sports data, specifically cricket short text commentaries, to construct and visualize individual players' strength and weakness rules. It introduces a computationally feasible definition for these rules and presents a visualization technique, demonstrating its utility and validating the results through multiple methods.
Paper Preview
Abstract
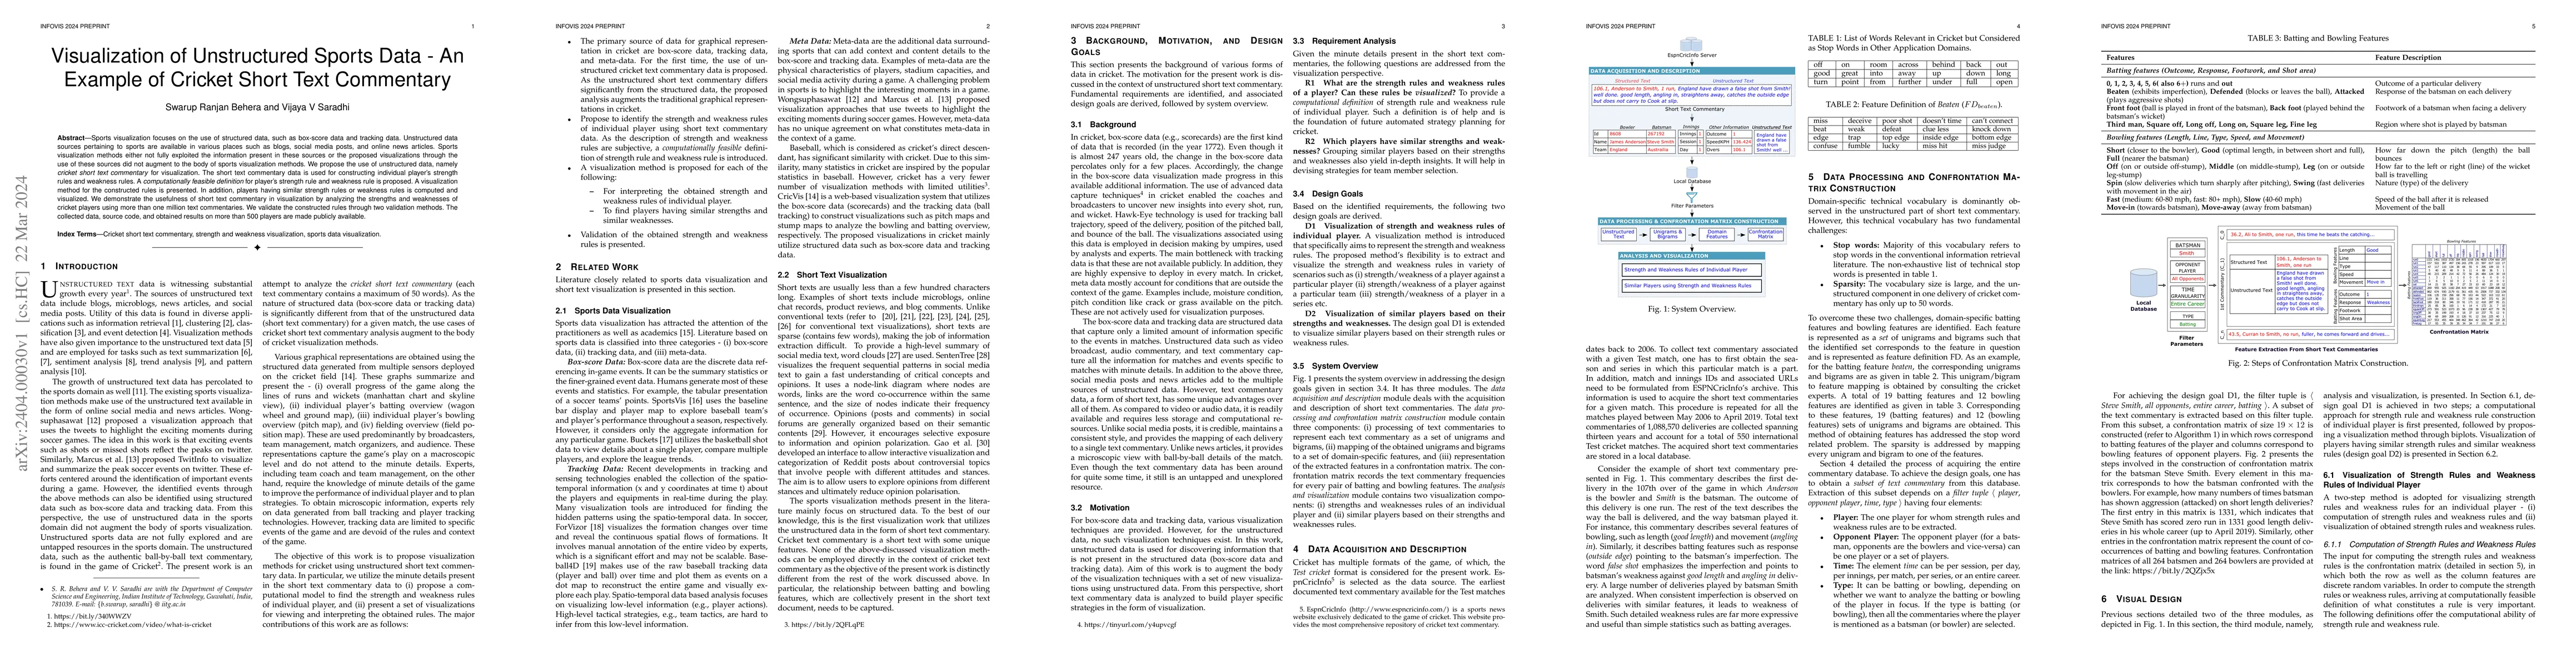
Sports visualization focuses on the use of structured data, such as box-score data and tracking data. Unstructured data sources pertaining to sports are available in various places such as blogs, social media posts, and online news articles. Sports visualization methods either not fully exploited the information present in these sources or the proposed visualizations through the use of these sources did not augment to the body of sports visualization methods. We propose the use of unstructured data, namely cricket short text commentary for visualization. The short text commentary data is used for constructing individual player's strength rules and weakness rules. A computationally feasible definition for player's strength rule and weakness rule is proposed. A visualization method for the constructed rules is presented. In addition, players having similar strength rules or weakness rules is computed and visualized. We demonstrate the usefulness of short text commentary in visualization by analyzing the strengths and weaknesses of cricket players using more than one million text commentaries. We validate the constructed rules through two validation methods. The collected data, source code, and obtained results on more than 500 players are made publicly available.
AI Key Findings
Get AI-generated insights about this paper's methodology, results, significance, and more — seven facets brought into focus.
Impact
Paper Details
Authors
PDF Preview
Key Terms
Citation Network
Current paper (gray), citations (green), references (blue)
Display is limited for performance on very large graphs.
Discussion 0