Visualization Requirements for Business Intelligence Analytics: A Goal-Based, Iterative Framework
Publication
Metrics
AI Quick Summary
This paper presents an iterative, goal-oriented framework for deriving appropriate data visualizations in business intelligence analytics, addressing the challenge of non-expert users defining suitable visualizations. The proposed approach uses the i* language to link user goals with data, semi-automatically selecting the best visualization techniques to avoid misinterpretation and missed opportunities.
Paper Preview
Abstract
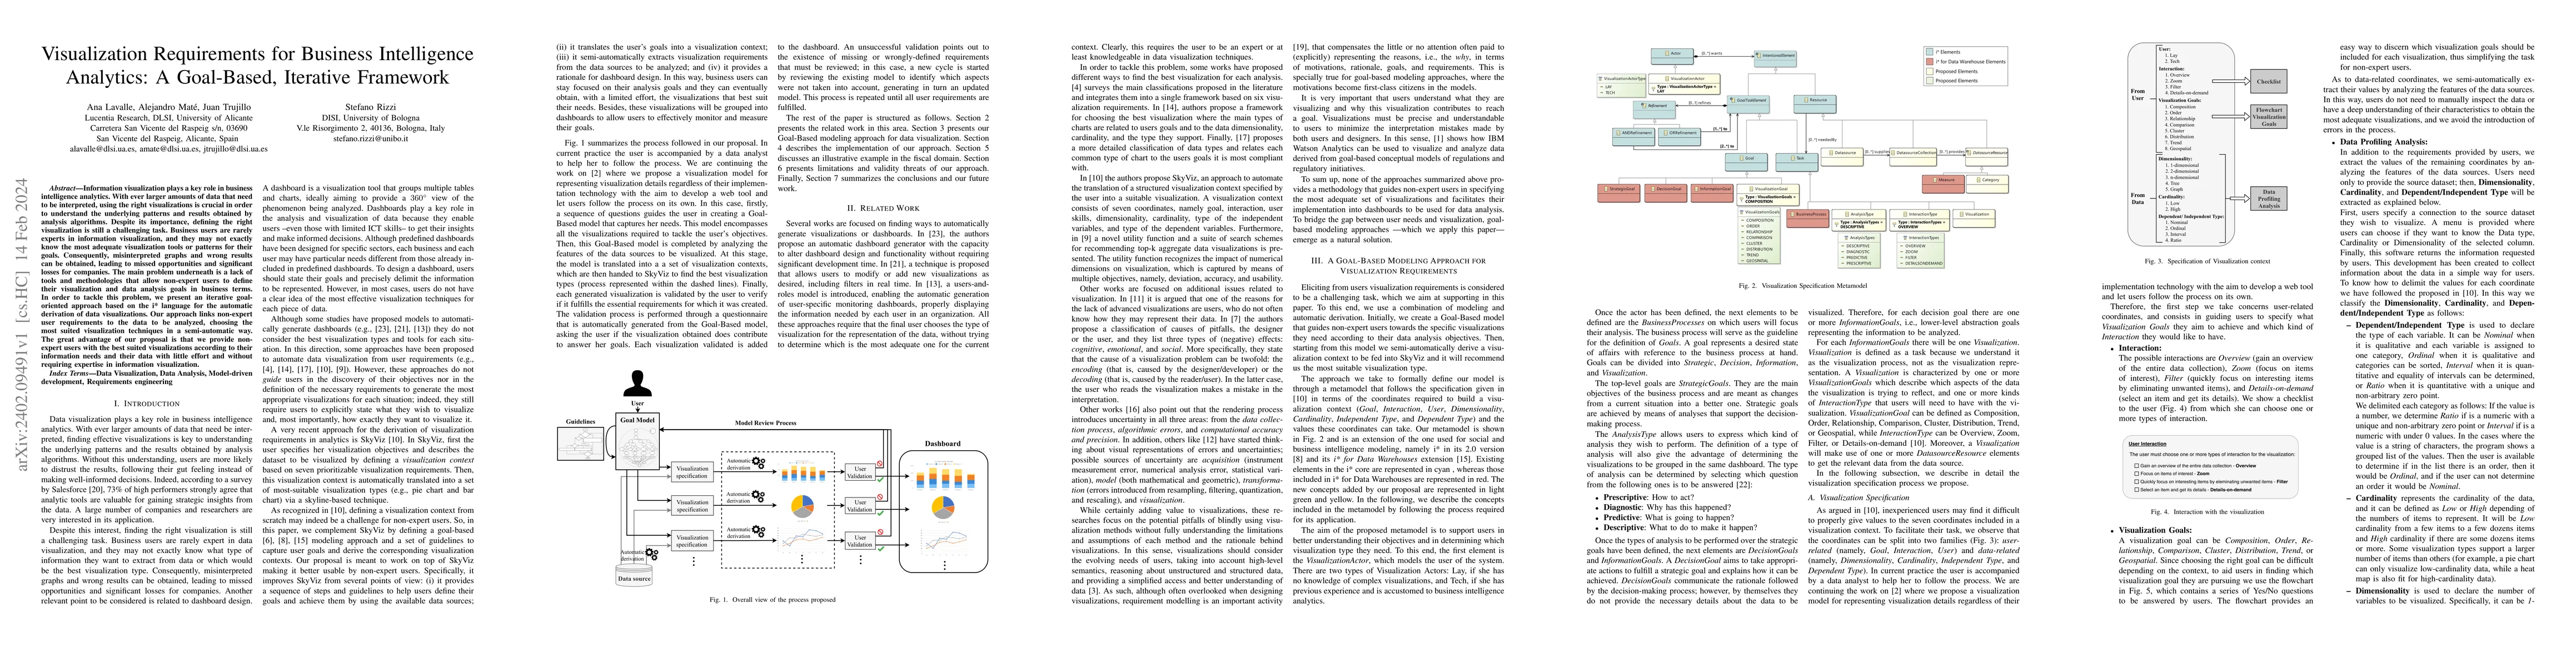
Information visualization plays a key role in business intelligence analytics. With ever larger amounts of data that need to be interpreted, using the right visualizations is crucial in order to understand the underlying patterns and results obtained by analysis algorithms. Despite its importance, defining the right visualization is still a challenging task. Business users are rarely experts in information visualization, and they may not exactly know the most adequate visualization tools or patterns for their goals. Consequently, misinterpreted graphs and wrong results can be obtained, leading to missed opportunities and significant losses for companies. The main problem underneath is a lack of tools and methodologies that allow non-expert users to define their visualization and data analysis goals in business terms. In order to tackle this problem, we present an iterative goal-oriented approach based on the i* language for the automatic derivation of data visualizations. Our approach links non-expert user requirements to the data to be analyzed, choosing the most suited visualization techniques in a semi-automatic way. The great advantage of our proposal is that we provide non-expert users with the best suited visualizations according to their information needs and their data with little effort and without requiring expertise in information visualization.
AI Key Findings
Get AI-generated insights about this paper's methodology, results, significance, and more — seven facets brought into focus.
Impact
Paper Details
Authors
PDF Preview
Key Terms
Citation Network
Current paper (gray), citations (green), references (blue)
Display is limited for performance on very large graphs.
Discussion 0