Visualizing class specific heterogeneous tendencies in categorical data
Publication
Metrics
AI Quick Summary
This paper introduces a new method for visualizing class-specific heterogeneous tendencies in categorical data using multiple-set cluster correspondence analysis. The proposed approach enhances multiple correspondence analysis biplots by incorporating additional categorical variables, facilitating better interpretation of relationships between individuals and categories, as demonstrated through a simulation study and an application to UK road accident data.
Paper Preview
Abstract
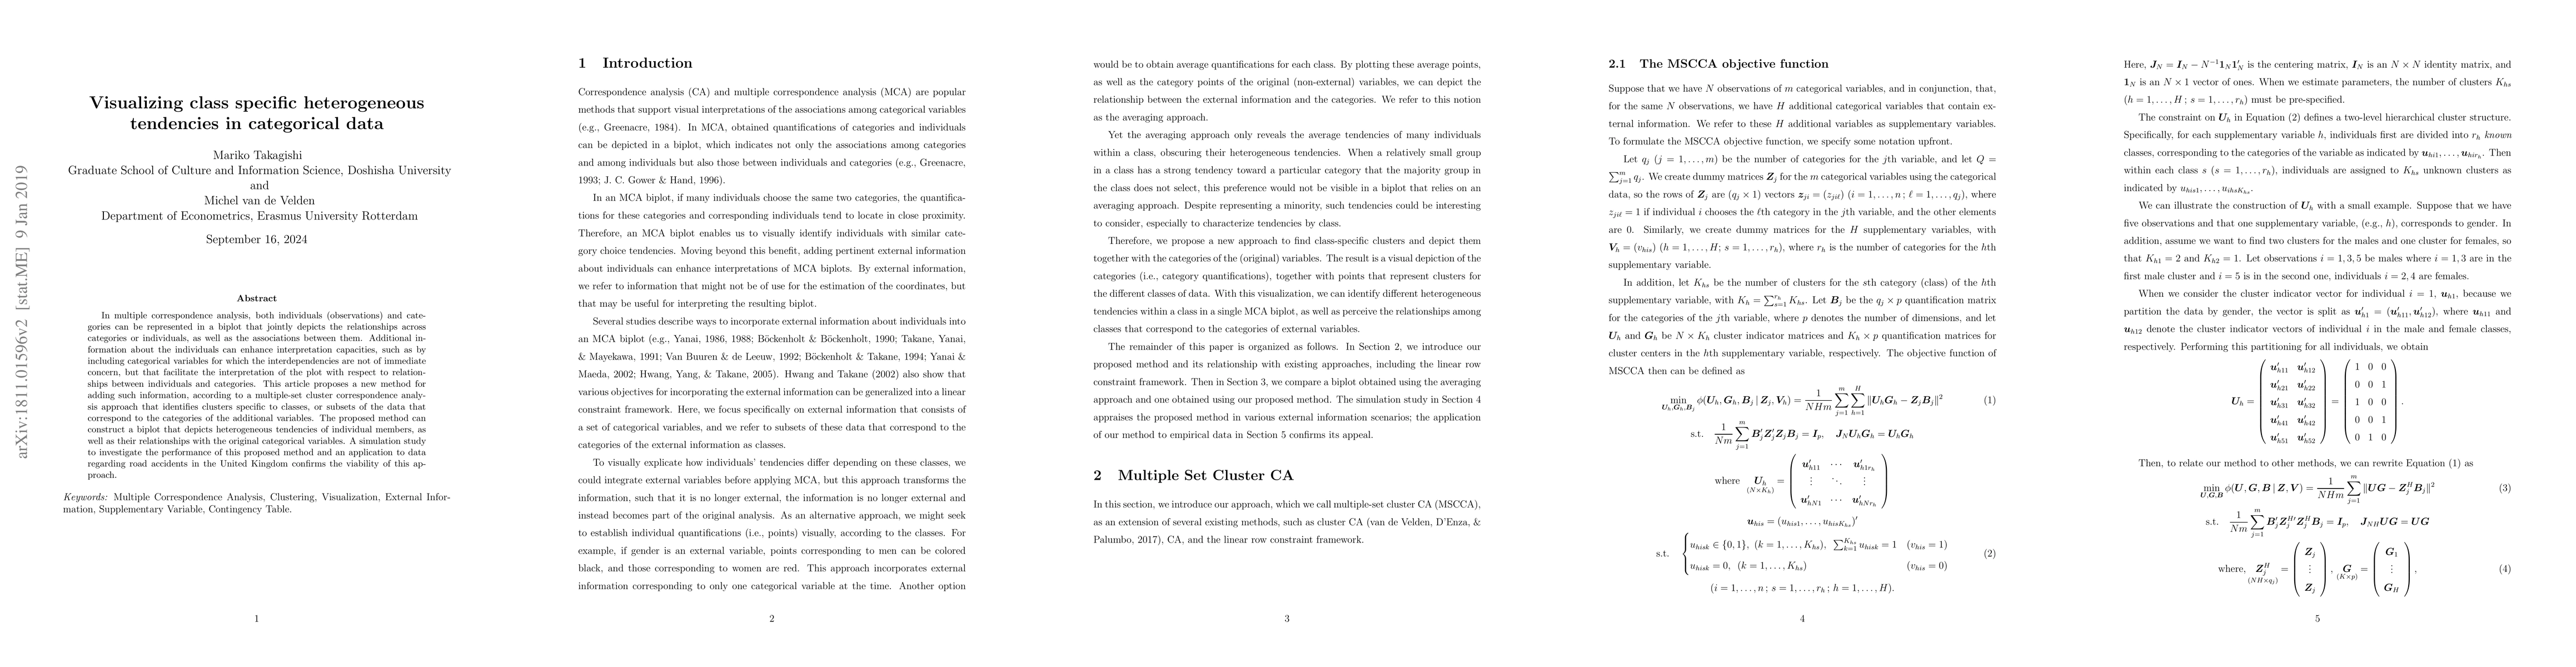
In multiple correspondence analysis, both individuals (observations) and categories can be represented in a biplot that jointly depicts the relationships across categories or individuals, as well as the associations between them. Additional information about the individuals can enhance interpretation capacities, such as by including categorical variables for which the interdependencies are not of immediate concern, but that facilitate the interpretation of the plot with respect to relationships between individuals and categories. This article proposes a new method for adding such information, according to a multiple-set cluster correspondence analysis approach that identifies clusters specific to classes, or subsets of the data that correspond to the categories of the additional variables. The proposed method can construct a biplot that depicts heterogeneous tendencies of individual members, as well as their relationships with the original categorical variables. A simulation study to investigate the performance of this proposed method and an application to data regarding road accidents in the United Kingdom confirms the viability of this approach.
AI Key Findings
Get AI-generated insights about this paper's methodology, results, significance, and more — seven facets brought into focus.
Impact
Paper Details
PDF Preview
Key Terms
Citation Network
Current paper (gray), citations (green), references (blue)
Display is limited for performance on very large graphs.
Discussion 0