Visualizing Collective Idea Generation and Innovation Processes in Social Networks
Publication
Metrics
AI Quick Summary
This study introduces three innovative visualization methods—Idea Cloud, Idea Geography, and Idea Network—to monitor and analyze collective idea generation and innovation processes in online social networks. These tools provide insights into idea clustering, collaboration dynamics, and the influence of social structures on innovation.
Paper Preview
Abstract
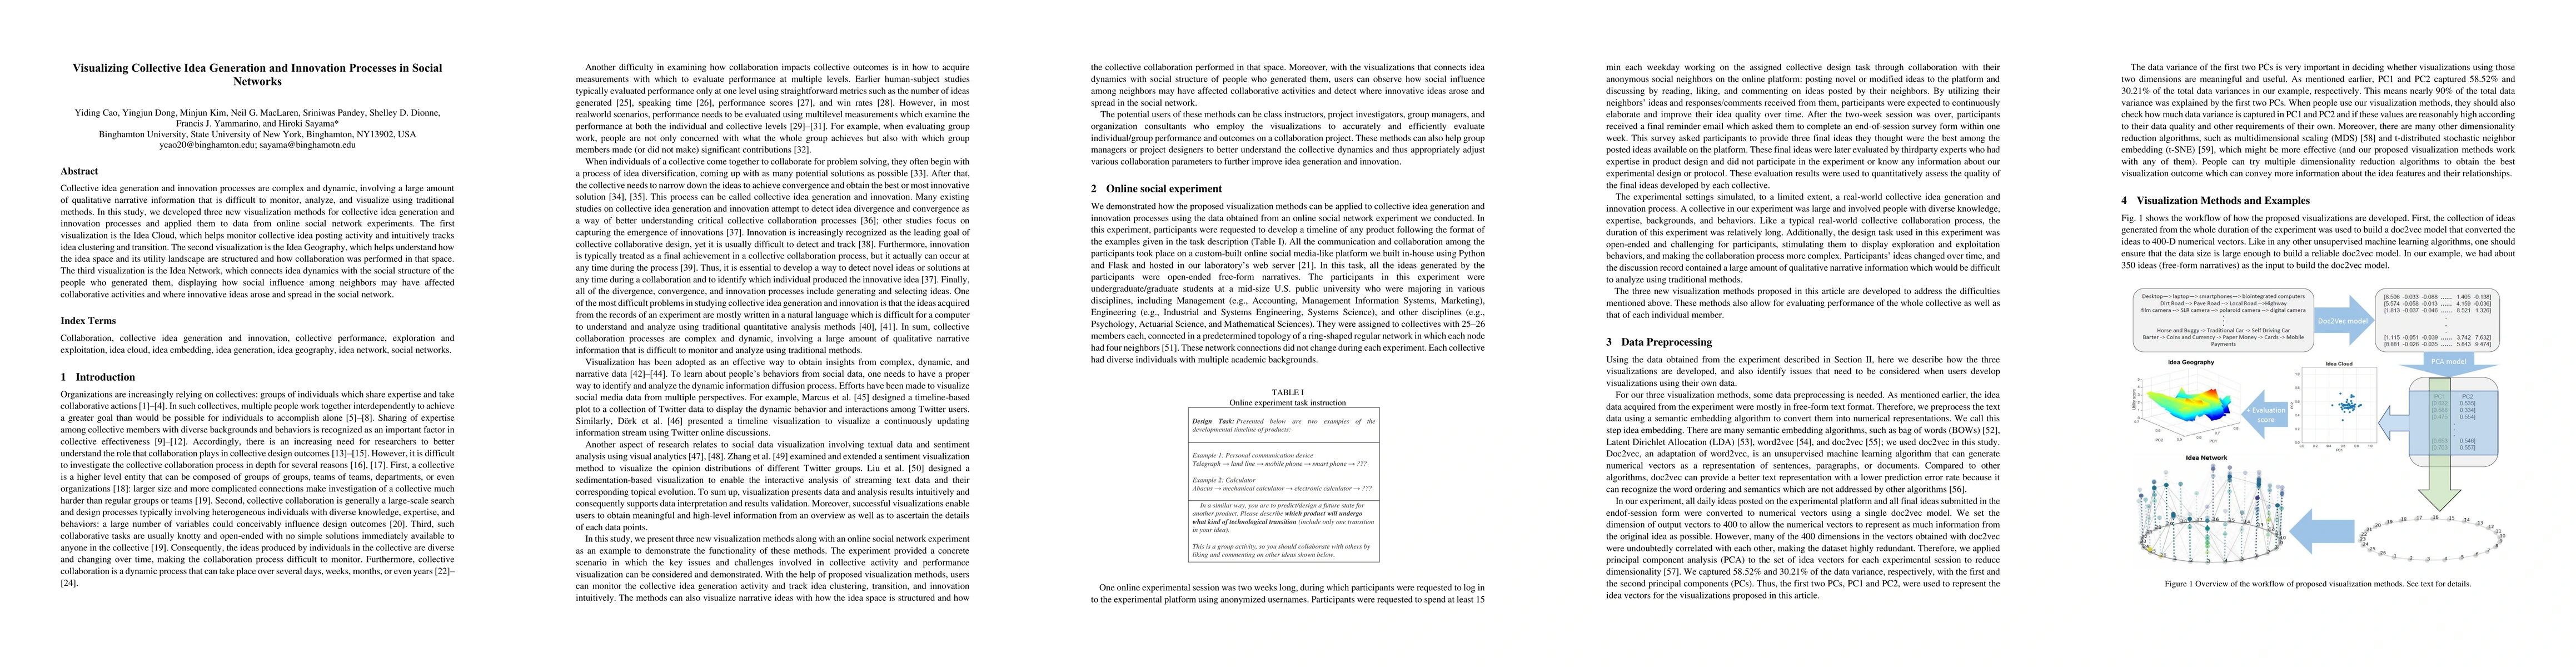
Collective idea generation and innovation processes are complex and dynamic, involving a large amount of qualitative narrative information that is difficult to monitor, analyze, and visualize using traditional methods. In this study, we developed three new visualization methods for collective idea generation and innovation processes and applied them to data from online social network experiments. The first visualization is the Idea Cloud, which helps monitor collective idea posting activity and intuitively tracks idea clustering and transition. The second visualization is the Idea Geography, which helps understand how the idea space and its utility landscape are structured and how collaboration was performed in that space. The third visualization is the Idea Network, which connects idea dynamics with the social structure of the people who generated them, displaying how social influence among neighbors may have affected collaborative activities and where innovative ideas arose and spread in the social network.
AI Key Findings
Get AI-generated insights about this paper's methodology, results, significance, and more — seven facets brought into focus.
Impact
Paper Details
Authors
PDF Preview
Key Terms
Citation Network
Current paper (gray), citations (green), references (blue)
Display is limited for performance on very large graphs.
Discussion 0