Visualizing Deep Neural Networks for Speech Recognition with Learned Topographic Filter Maps
Publication
Metrics
AI Quick Summary
Researchers created a new way to visualize how deep neural networks process speech, revealing patterns in brain-like neuron arrangements that help with speech recognition. This technique can improve understanding of how these models work.
Paper Preview
Abstract
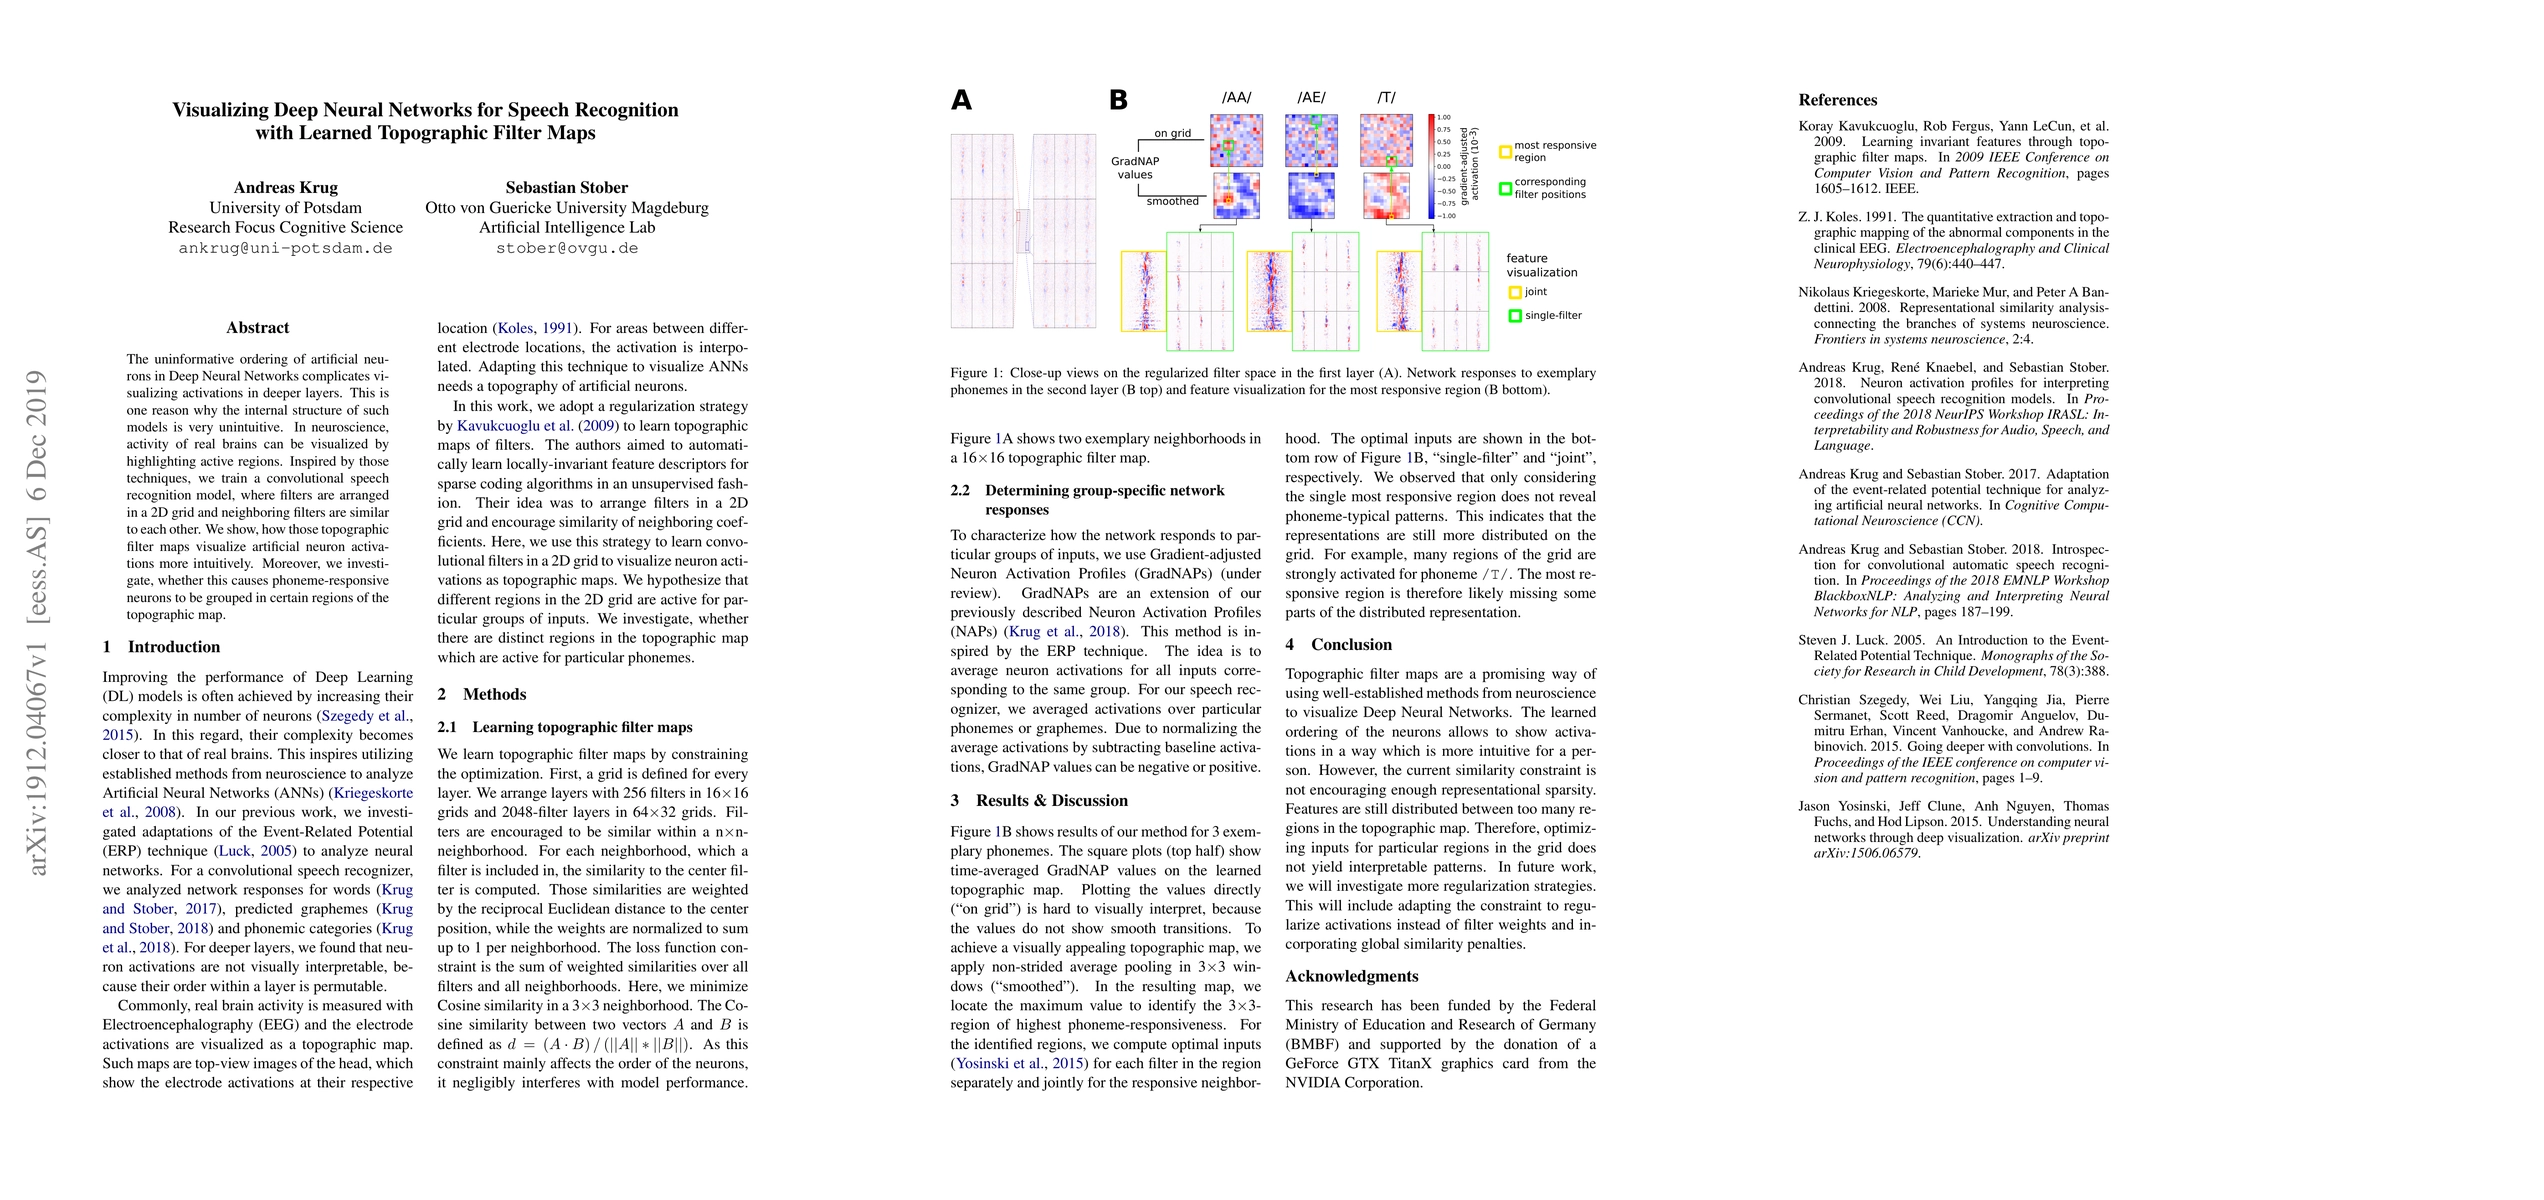
The uninformative ordering of artificial neurons in Deep Neural Networks complicates visualizing activations in deeper layers. This is one reason why the internal structure of such models is very unintuitive. In neuroscience, activity of real brains can be visualized by highlighting active regions. Inspired by those techniques, we train a convolutional speech recognition model, where filters are arranged in a 2D grid and neighboring filters are similar to each other. We show, how those topographic filter maps visualize artificial neuron activations more intuitively. Moreover, we investigate, whether this causes phoneme-responsive neurons to be grouped in certain regions of the topographic map.
AI Key Findings
Get AI-generated insights about this paper's methodology, results, significance, and more — seven facets brought into focus.
Impact
Paper Details
Authors
PDF Preview
Key Terms
Citation Network
Current paper (gray), citations (green), references (blue)
Display is limited for performance on very large graphs.
Discussion 0