ArxivLens

Quick Summary:

This paper introduces DIG, a novel visualization method for high-dimensional dynamical processes using information geometry and diffusion operators. The method aims to reveal hidden structures in multivariate time series data, demonstrated through a case study on EEG data to visualize sleep stages.

Journal Reference: IEEE International Workshop on Machine Learning for Signal Processing, Oct. 2019
DOI: 10.1109/MLSP.2019.8918875
arXiv Id: 1906.10725
Comments: 7 pages, 3 figures
Date Published: 2021-07-30
Date Updated: 2021-07-30

Categories:

Key Terms (TF-IDF):

visualization (0.266)
diffusion (0.260)
time series (0.243)
diffusion (0.240)
time series (0.235)
distances (0.229)
distances (0.212)
geometry (0.191)
series (0.190)
geometry (0.186)
dynamical (0.182)
series (0.178)
eeg (0.178)
dynamical (0.177)
insufficient (0.167)
dynamical systems (0.163)
low dimensional (0.162)
multivariate (0.156)
case study (0.156)
data (0.156)
License: http://arxiv.org/licenses/nonexclusive-distrib/1.0/

Summary:

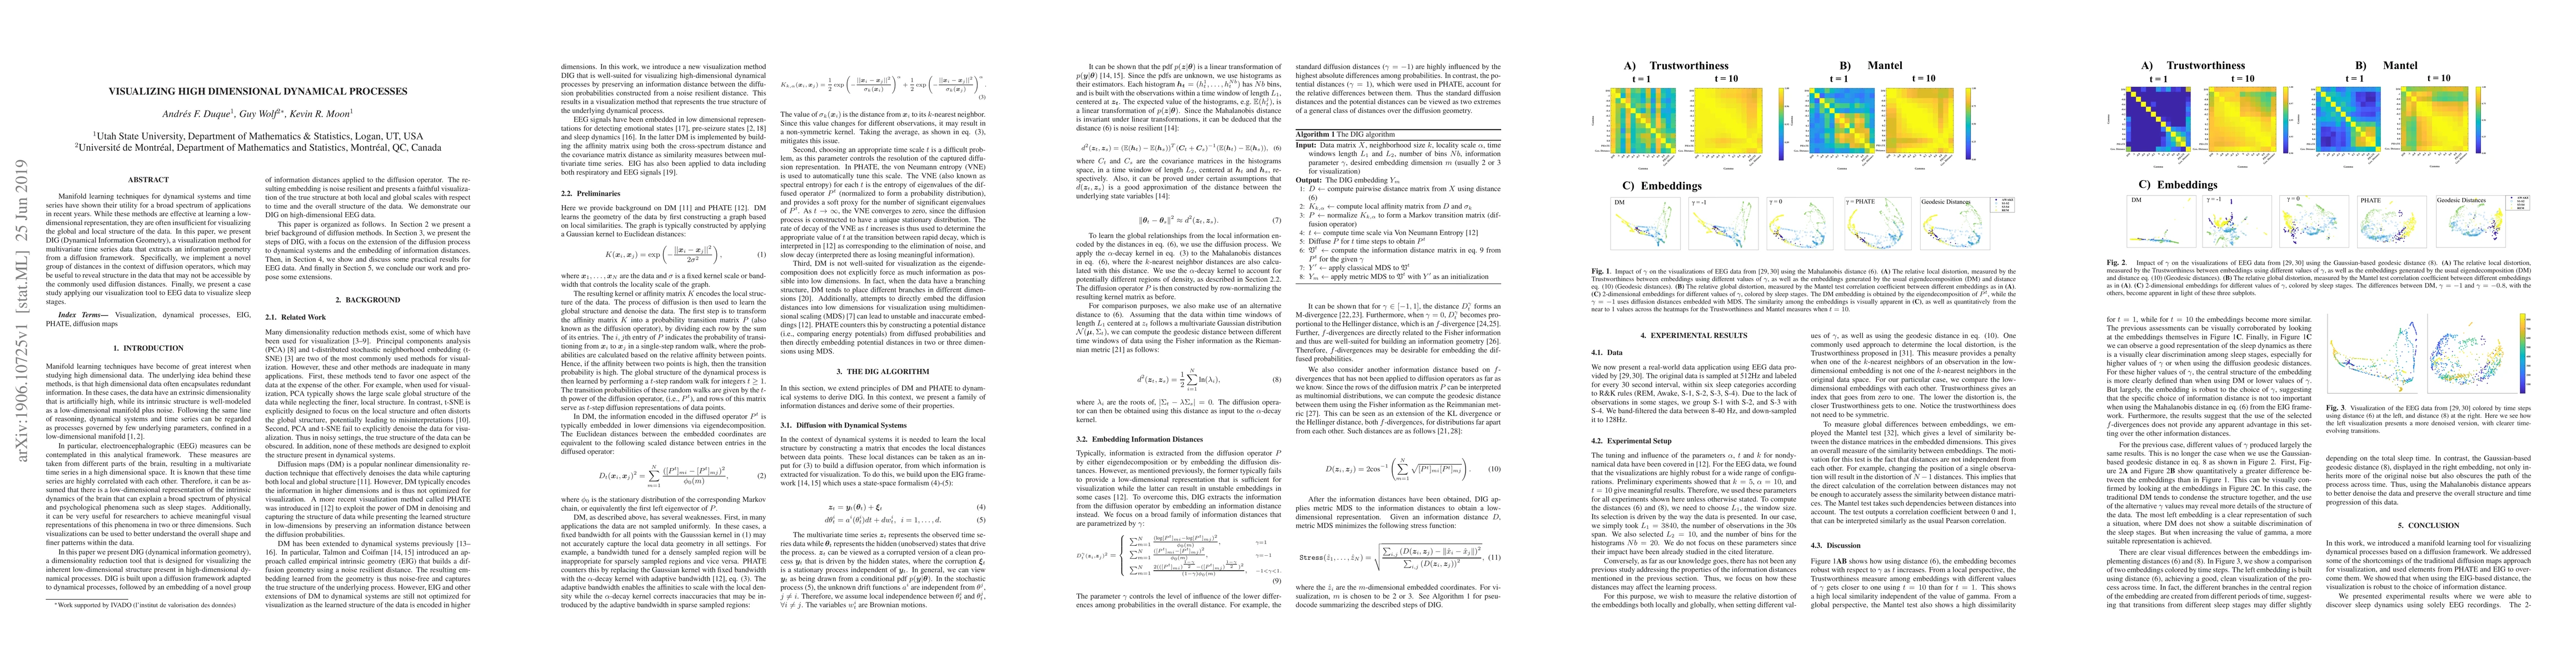
Manifold learning techniques for dynamical systems and time series have shown their utility for a broad spectrum of applications in recent years. While these methods are effective at learning a low-dimensional representation, they are often insufficient for visualizing the global and local structure of the data. In this paper, we present DIG (Dynamical Information Geometry), a visualization method for multivariate time series data that extracts an information geometry from a diffusion framework. Specifically, we implement a novel group of distances in the context of diffusion operators, which may be useful to reveal structure in the data that may not be accessible by the commonly used diffusion distances. Finally, we present a case study applying our visualization tool to EEG data to visualize sleep stages.

Citation & Reference Network Visualization

This graph shows how this paper is connected to other research. The current paper is shown in dark gray, papers that cite it are in green, and papers it references are in blue. You can:

Current Paper
Papers citing this work (Citations)
Papers cited by this work (References)

• Hover over any node to see the paper title

• Click a node to view that paper's details

• Drag nodes to rearrange the graph

• Use the zoom controls (bottom right) to zoom in/out

Citations and References

Title Authors Year Actions
Graph Integration for Diffusion-Based Manifold Alignment
Jake S. Rhodes, Adam G. Rustad
2024
View Paper
Noisy Data Visualization using Functional Data Analysis
Haozhe Chen, A. F. D. Correa, Guy Wolf, Kevin R. Moon
2024
View Paper
Functional connectivity in people at clinical and familial high risk for schizophrenia
Jian Zhang, Yaxin Yang, Tiantian Liu, Zhongyan Shi, Guangying Pei, L. xilinx Wang, Jinglong Wu, Shintaro Funahashi, Dingjie Suo, Changming Wang, Tianyi Yan
2023
View Paper
Geometry Regularized Autoencoders
Andres F. Duque, Sacha Morin, Guy Wolf, Kevin R. Moon
2022
View Paper
Information and Communication Technology in Migration: A Framework for Applications, Customization, and Research
A. Arya, L. Nardon, M. Riyadh
2022
View Paper
Multiscale PHATE identifies multimodal signatures of COVID-19
Manik Kuchroo, Je-chun Huang, P. Wong, Jean-Christophe Grenier, Dennis L. Shung, Alexander Tong, C. Lucas, J. Klein, Daniel B. Burkhardt, Scott A. Gigante, Abhinav Godavarthi, Bastian Rieck, Benjamin Israelow, M. Simonov, Tianyang Mao, J. E. Oh, Julio Silva, Takehiro Takahashi, C. Odio, A. Casanovas-Massana, John B. Fournier, S. Farhadian, C. D. Dela Cruz, A. Ko, M. Hirn, F. Wilson, J. Hussin, Guy Wolf, A. Iwasaki, Smita Krishnaswamy
2022
View Paper
Geometry- and Accuracy-Preserving Random Forest Proximities
Jake S. Rhodes, Adele Cutler, Kevin R. Moon
2022
View Paper
Random Forest-Based Diffusion Information Geometry for Supervised Visualization and Data Exploration
Jake S. Rhodes, Adele Cutler, Guy Wolf, Kevin R. Moon
2021
View Paper
Extendable and invertible manifold learning with geometry regularized autoencoders
Andres F. Duque, Sacha Morin, Guy Wolf, Kevin R. Moon
2020
View Paper
Supervised Visualization for Data Exploration
Jake S. Rhodes, Adele Cutler, Guy Wolf, Kevin R. Moon
2020
View Paper
Learning Manifolds from Dynamic Process Data
Frank Schoeneman, V. Chandola, N. Napp, O. Wodo, J. Zola
2020
View Paper
Visual Analysis of Industrial Multivariate Time-Series Data Effective Solution to Maximise Insights from Blow Moulding Machine Sensory Data
Ilir Jusufi
2021
View Paper

Comments (0)

This website uses cookies to ensure you get the best experience. Learn more