Publication
Metrics
AI Quick Summary
This paper presents a novel technique to visualize U.S. household income distribution and inequality over time using microdata from the Current Population Survey, resulting in a dynamic animation that highlights the impact of economic inequality on life quality. The project's detailed implementation is available on GitHub.
Paper Preview
Abstract
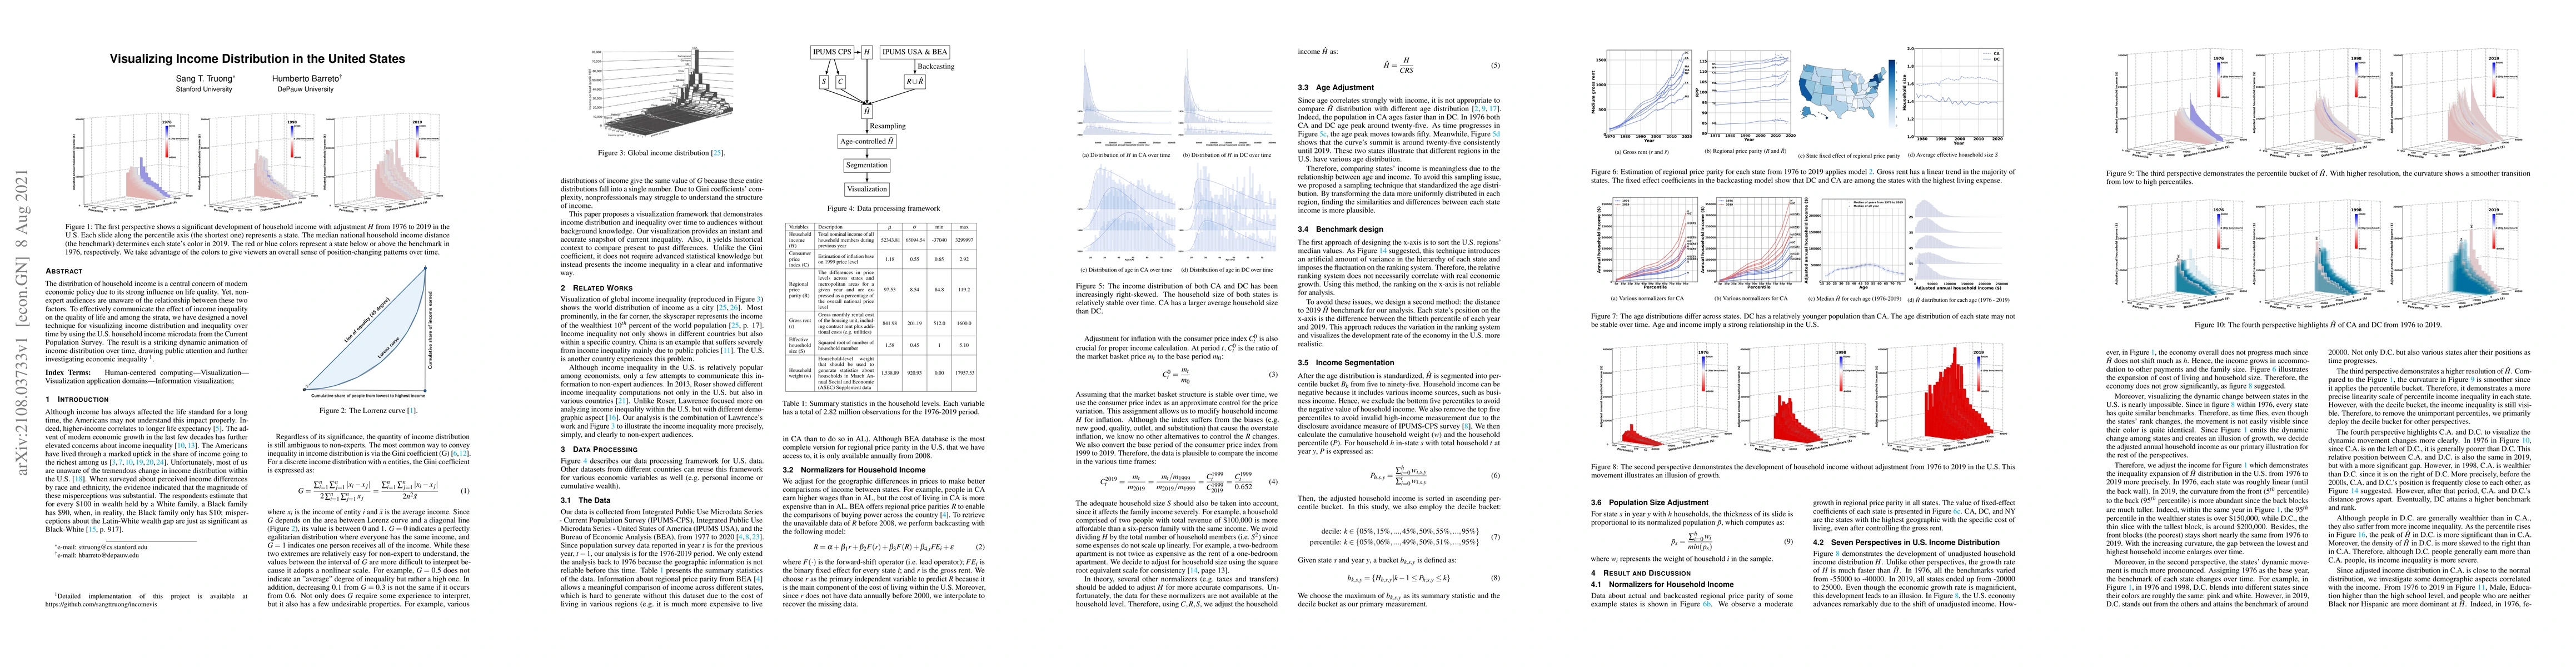
The distribution of household income is a central concern of modern economic policy due to its strong influence on life quality. Yet, non-expert audiences are unaware of the relationship between these two factors. To effectively communicate the effect of income inequality on the quality of life and among the strata, we have designed a novel technique for visualizing income distribution and inequality over time by using the U.S. household income microdata from the Current Population Survey. The result is a striking dynamic animation of income distribution over time, drawing public attention and further investigating economic inequality. Detailed implementation of this project is available at https://github.com/sangttruong/incomevis.
AI Key Findings
Get AI-generated insights about this paper's methodology, results, significance, and more — seven facets brought into focus.
Impact
Paper Details
Authors
PDF Preview
Key Terms
Citation Network
Current paper (gray), citations (green), references (blue)
Display is limited for performance on very large graphs.
Discussion 0