Visualizing information on watch faces: A survey with smartwatch users
Publication
Metrics
AI Quick Summary
This study surveys 237 smartwatch users to understand current data visualization on watch faces, finding that health & fitness data is predominantly displayed using icons and text. The research identifies gaps in current visualizations and suggests opportunities for future research.
Paper Preview
Abstract
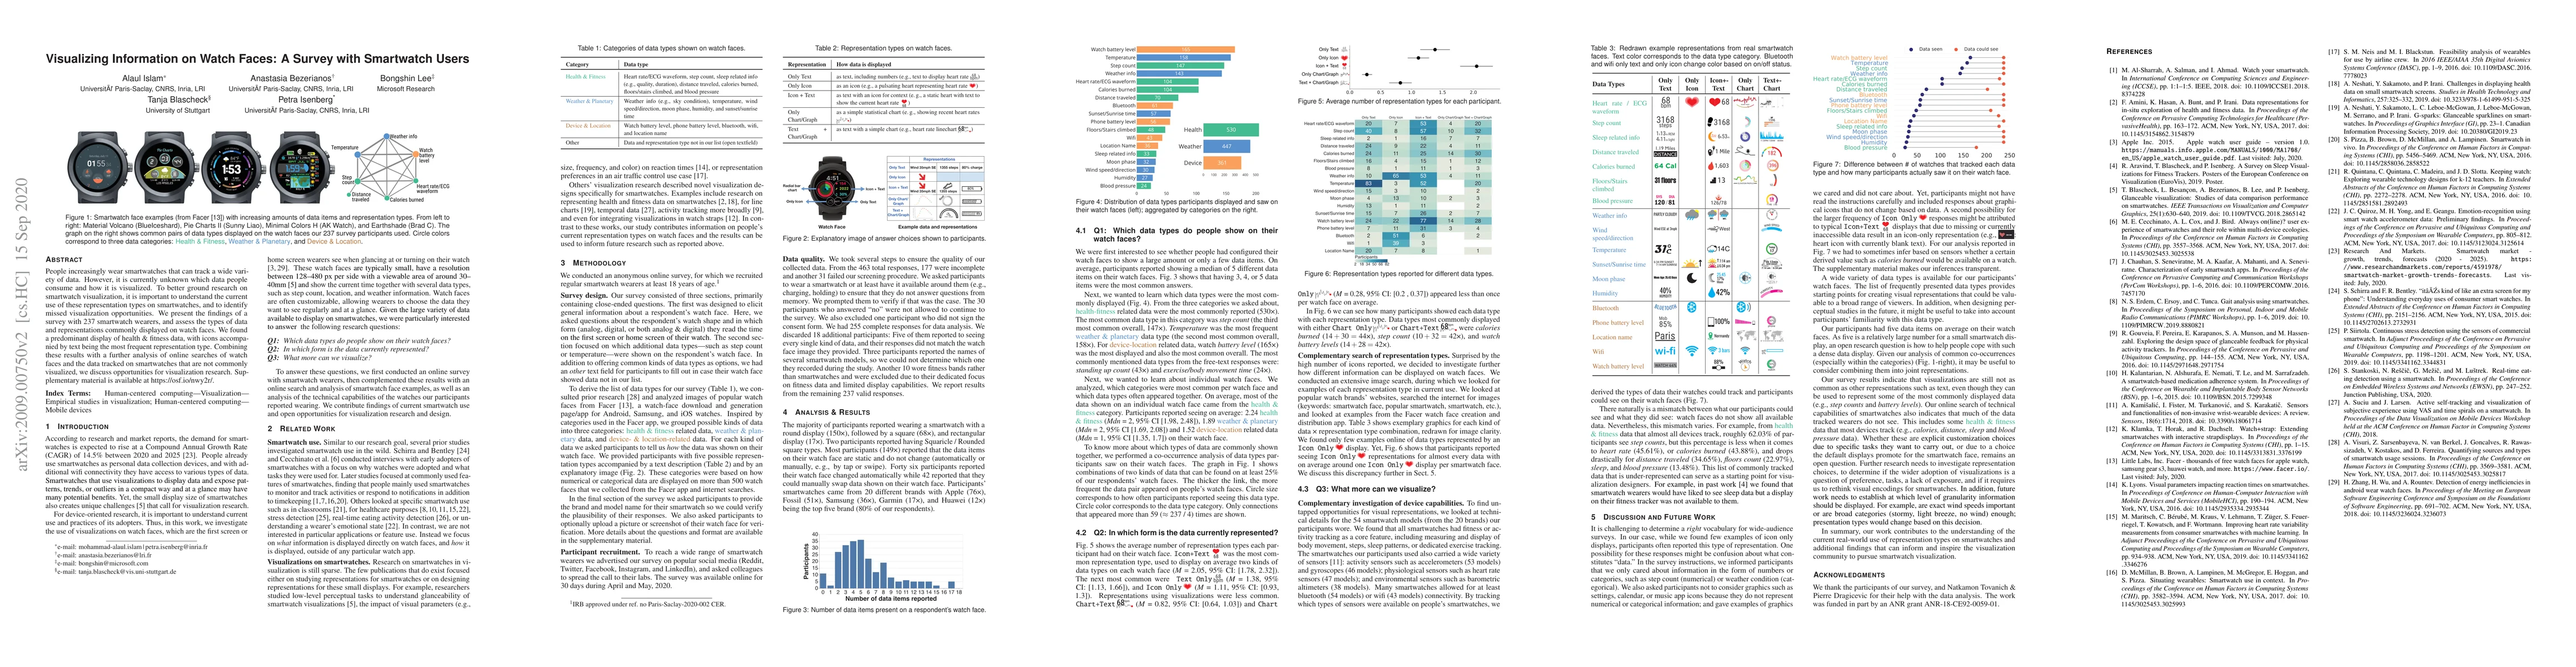
People increasingly wear smartwatches that can track a wide variety of data. However, it is currently unknown which data people consume and how it is visualized. To better ground research on smartwatch visualization, it is important to understand the current use of these representation types on smartwatches, and to identify missed visualization opportunities. We present the findings of a survey with 237 smartwatch wearers, and assess the types of data and representations commonly displayed on watch faces. We found a predominant display of health & fitness data, with icons accompanied by text being the most frequent representation type. Combining these results with a further analysis of online searches of watch faces and the data tracked on smartwatches that are not commonly visualized, we discuss opportunities for visualization research.
AI Key Findings
Get AI-generated insights about this paper's methodology, results, significance, and more — seven facets brought into focus.
Impact
Paper Details
Authors
PDF Preview
Key Terms
Citation Network
Current paper (gray), citations (green), references (blue)
Display is limited for performance on very large graphs.
Discussion 0