Publication
Metrics
AI Quick Summary
This paper introduces a novel method to visualize the large and complex intermediate representations generated by just-in-time compilers using a metro map metaphor, aiming to simplify debugging and enhance security by addressing the inherent difficulties in handling dynamic and intricate JIT compiler code.
Paper Preview
Abstract
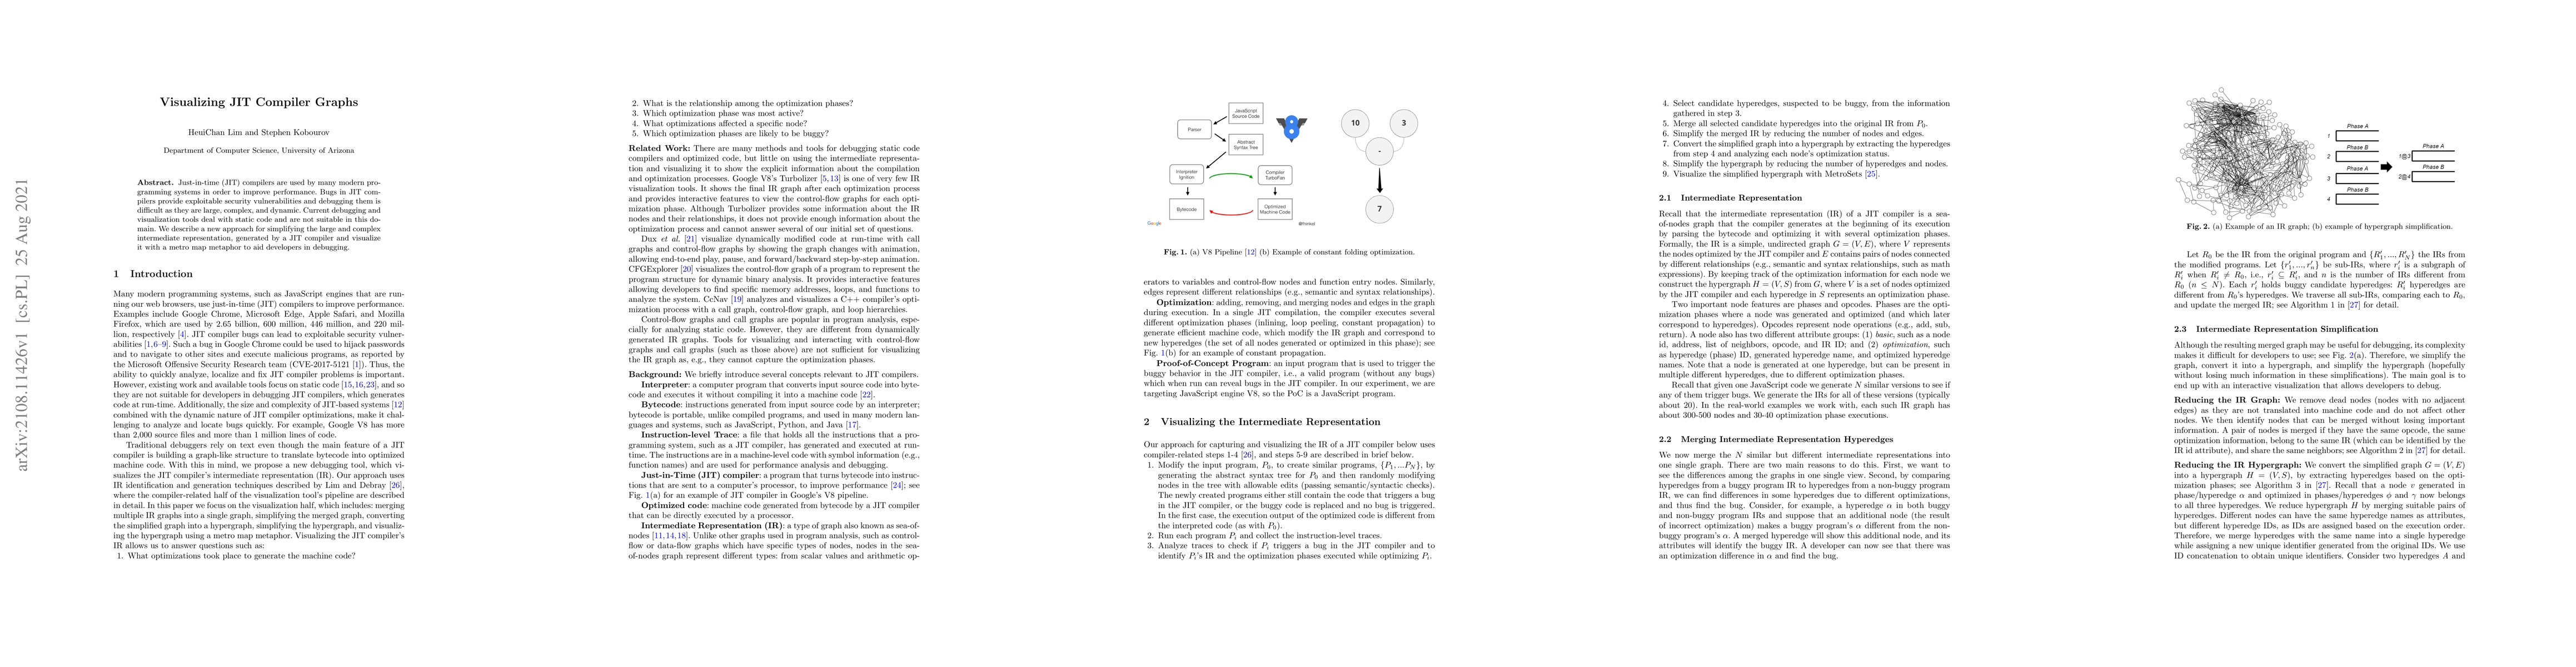
Just-in-time (JIT) compilers are used by many modern programming systems in order to improve performance. Bugs in JIT compilers provide exploitable security vulnerabilities and debugging them is difficult as they are large, complex, and dynamic. Current debugging and visualization tools deal with static code and are not suitable in this domain. We describe a new approach for simplifying the large and complex intermediate representation, generated by a JIT compiler and visualize it with a metro map metaphor to aid developers in debugging.
AI Key Findings
Get AI-generated insights about this paper's methodology, results, significance, and more — seven facets brought into focus.
Impact
Paper Details
Authors
PDF Preview
Key Terms
Citation Network
Current paper (gray), citations (green), references (blue)
Display is limited for performance on very large graphs.
Discussion 0