Authors
Publication
Metrics
Quick Actions
AI Quick Summary
The paper proposes the grill plot to enhance interpretability of linear prediction models by clearly showing which terms have the most influence, regardless of the model derivation. It also introduces a tailored display for visualizing correlations between predictors.
Paper Preview
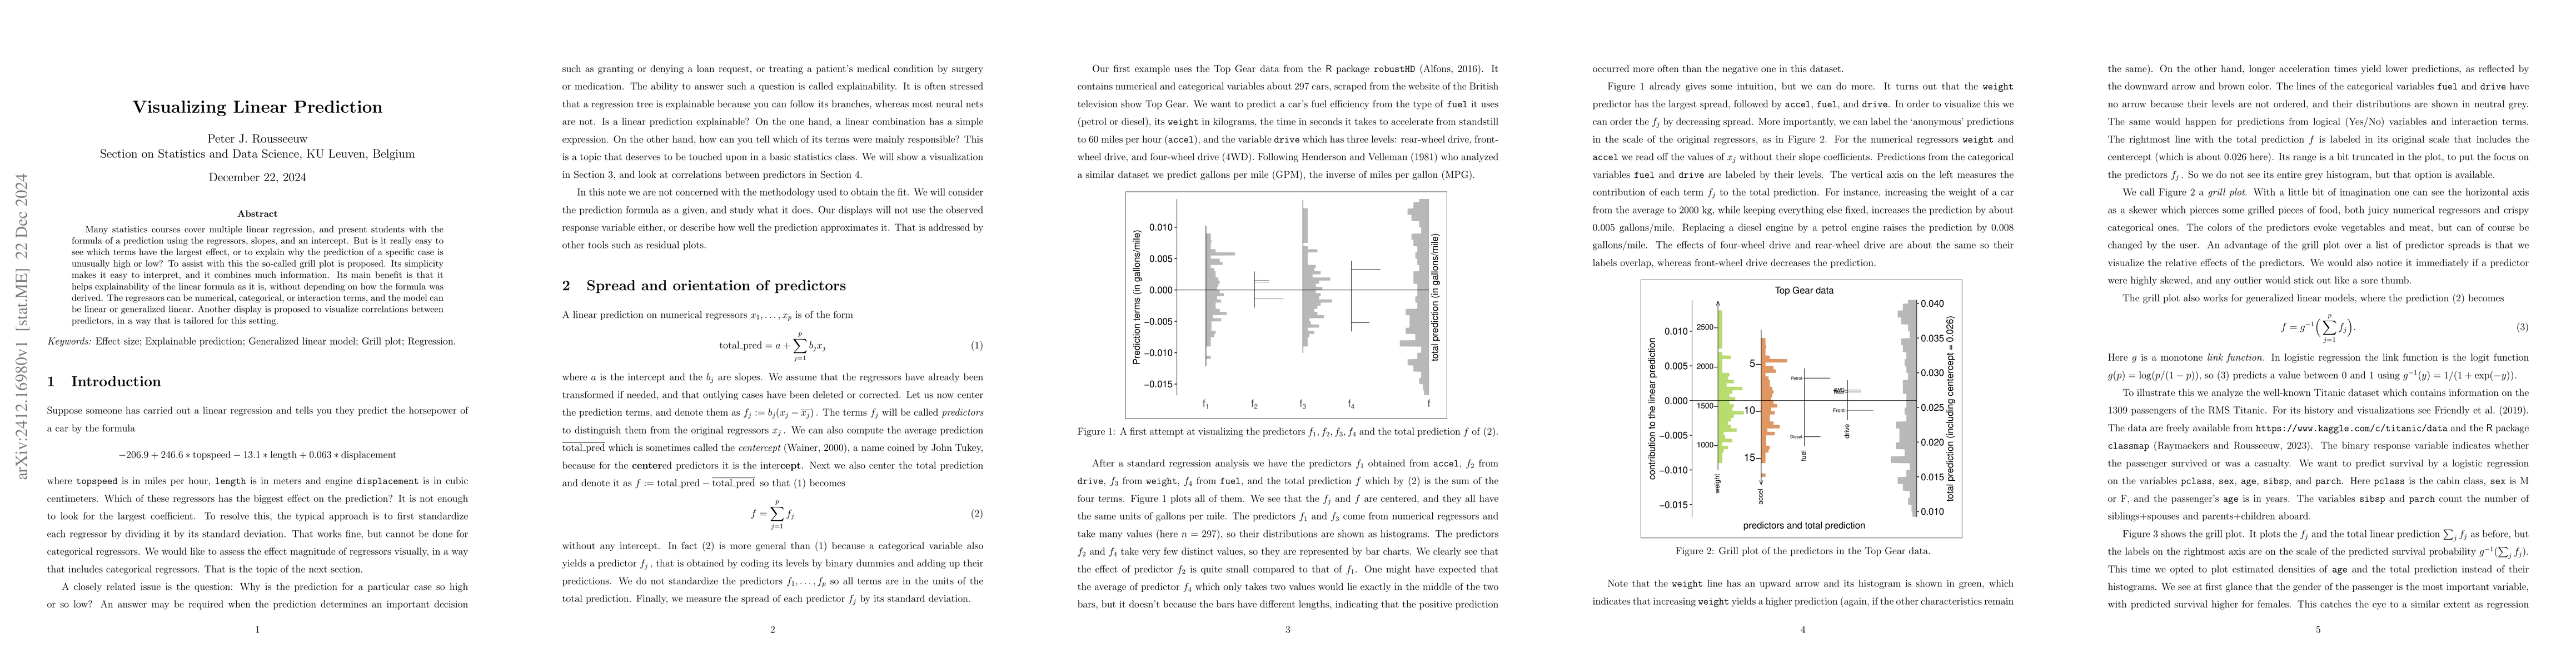
Abstract
Many statistics courses cover multiple linear regression, and present students with the formula of a prediction using the regressors, slopes, and an intercept. But is it really easy to see which terms have the largest effect, or to explain why the prediction of a specific case is unusually high or low? To assist with this the so-called grill plot is proposed. Its simplicity makes it easy to interpret, and it combines much information. Its main benefit is that it helps explainability of the linear formula as it is, without depending on how the formula was derived. The regressors can be numerical, categorical, or interaction terms, and the model can be linear or generalized linear. Another display is proposed to visualize correlations between predictors, in a way that is tailored for this setting.
AI Key Findings
Get AI-generated insights about this paper's methodology, results, and significance.
How to Cite This Paper
@article{rousseeuw2024visualizing,
  title         = {Visualizing Linear Prediction},
  author        = {Rousseeuw, Peter J.},
  year          = {2024},
  eprint        = {2412.16980},
  archivePrefix = {arXiv},
  primaryClass  = {stat.ME},
}Rousseeuw, P. (2024). Visualizing Linear Prediction. arXiv. https://arxiv.org/abs/2412.16980Rousseeuw, Peter J.. "Visualizing Linear Prediction." arXiv, 2024, arxiv.org/abs/2412.16980.PDF Preview
Citation Network
Current paper (gray), citations (green), references (blue)
Display is limited for performance on very large graphs.
Similar Papers
Found 4 papersVisualizing Multidimensional Linear Programming Problems
Nikolay A. Olkhovsky, Leonid B. Sokolinsky
A Comparison of Radial and Linear Charts for Visualizing Daily Pattern
Rainer Splechtna, Alexandra Diehl, Manuela Waldner et al.
No citations found for this paper.
Comments (0)