Visualizing Overlapping Biclusterings and Boolean Matrix Factorizations
Publication
Metrics
AI Quick Summary
This paper explores methods for visualizing overlapping biclusters in bipartite graphs and Boolean Matrix Factorizations, proposing objective functions and algorithms to optimize visualization criteria such as cluster element proximity and large uninterrupted areas. The study finds that a novel heuristic achieves the best balance by locally arranging rows and columns with similar cluster memberships.
Paper Preview
Abstract
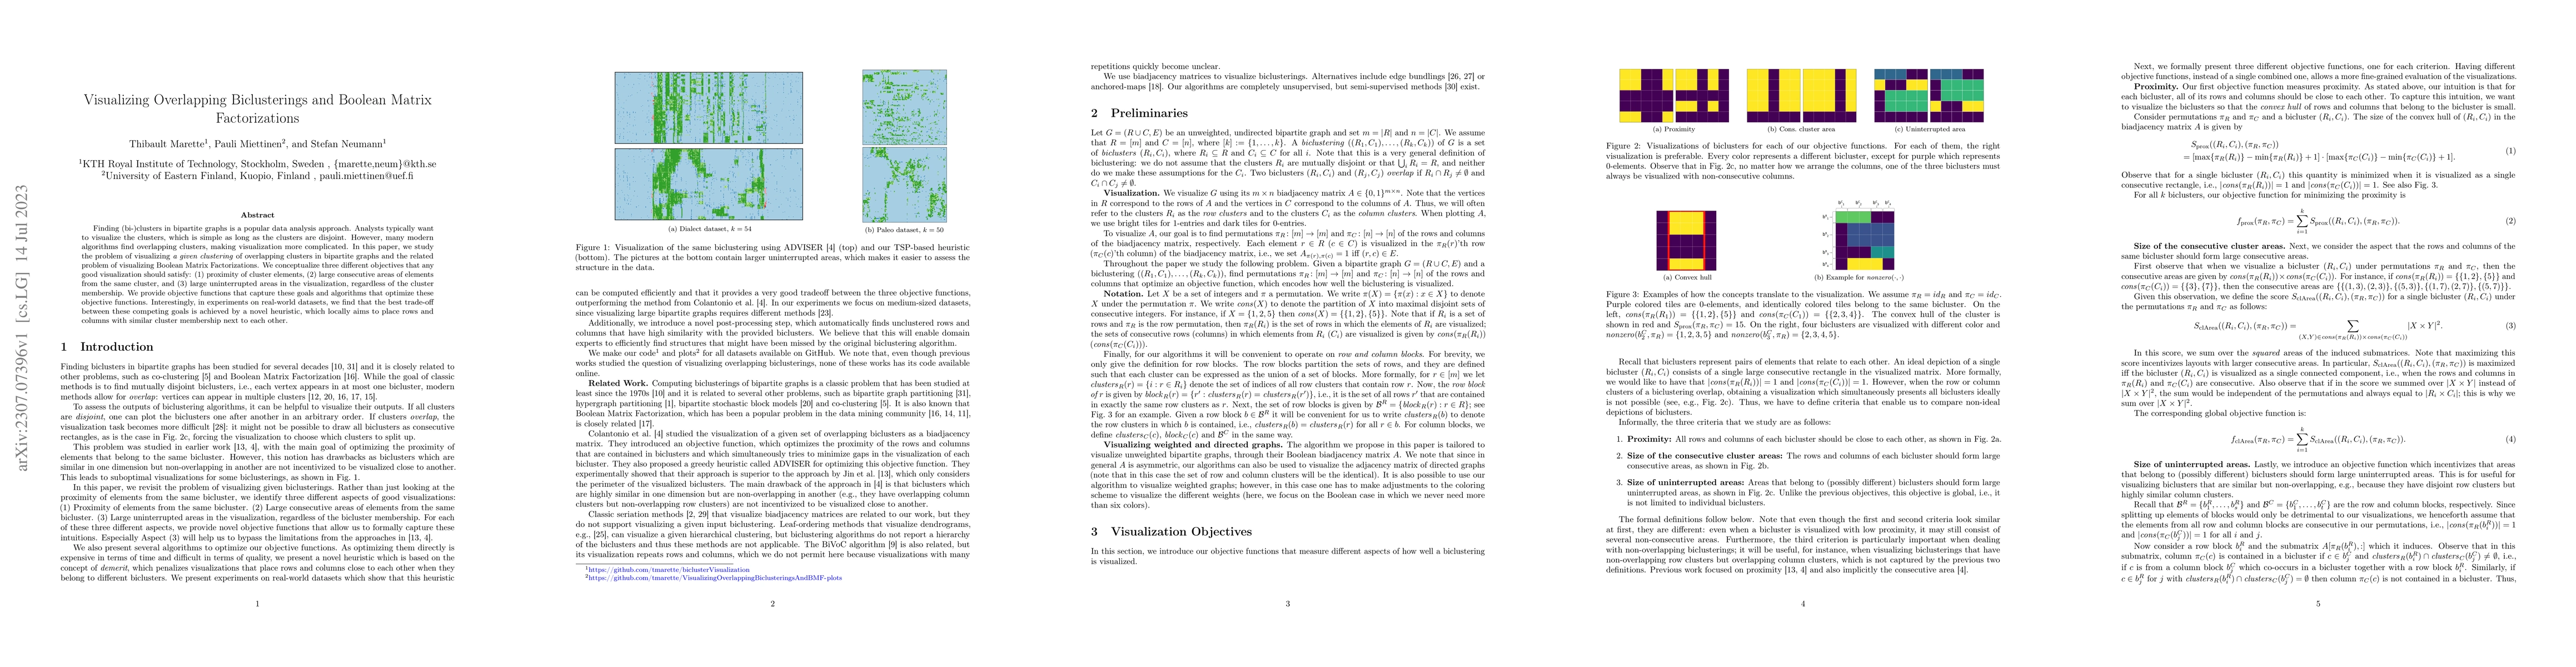
Finding (bi-)clusters in bipartite graphs is a popular data analysis approach. Analysts typically want to visualize the clusters, which is simple as long as the clusters are disjoint. However, many modern algorithms find overlapping clusters, making visualization more complicated. In this paper, we study the problem of visualizing \emph{a given clustering} of overlapping clusters in bipartite graphs and the related problem of visualizing Boolean Matrix Factorizations. We conceptualize three different objectives that any good visualization should satisfy: (1) proximity of cluster elements, (2) large consecutive areas of elements from the same cluster, and (3) large uninterrupted areas in the visualization, regardless of the cluster membership. We provide objective functions that capture these goals and algorithms that optimize these objective functions. Interestingly, in experiments on real-world datasets, we find that the best trade-off between these competing goals is achieved by a novel heuristic, which locally aims to place rows and columns with similar cluster membership next to each other.
AI Key Findings
Get AI-generated insights about this paper's methodology, results, significance, and more — seven facets brought into focus.
Impact
Paper Details
Authors
PDF Preview
Key Terms
Citation Network
Current paper (gray), citations (green), references (blue)
Display is limited for performance on very large graphs.
Discussion 0