Publication
Metrics
AI Quick Summary
This study uses scanning tunnelling microscopy to visualize electron pairing in high-Tc superconductor Bi2Sr2CaCu2O8+d, revealing nanoscale pairing gaps forming above the transition temperature Tc. The findings show that pairing gaps develop locally at a temperature Tp, following a specific relation, and provide insight into the microscopic basis for fluctuating superconducting responses observed in these materials.
Paper Preview
Abstract
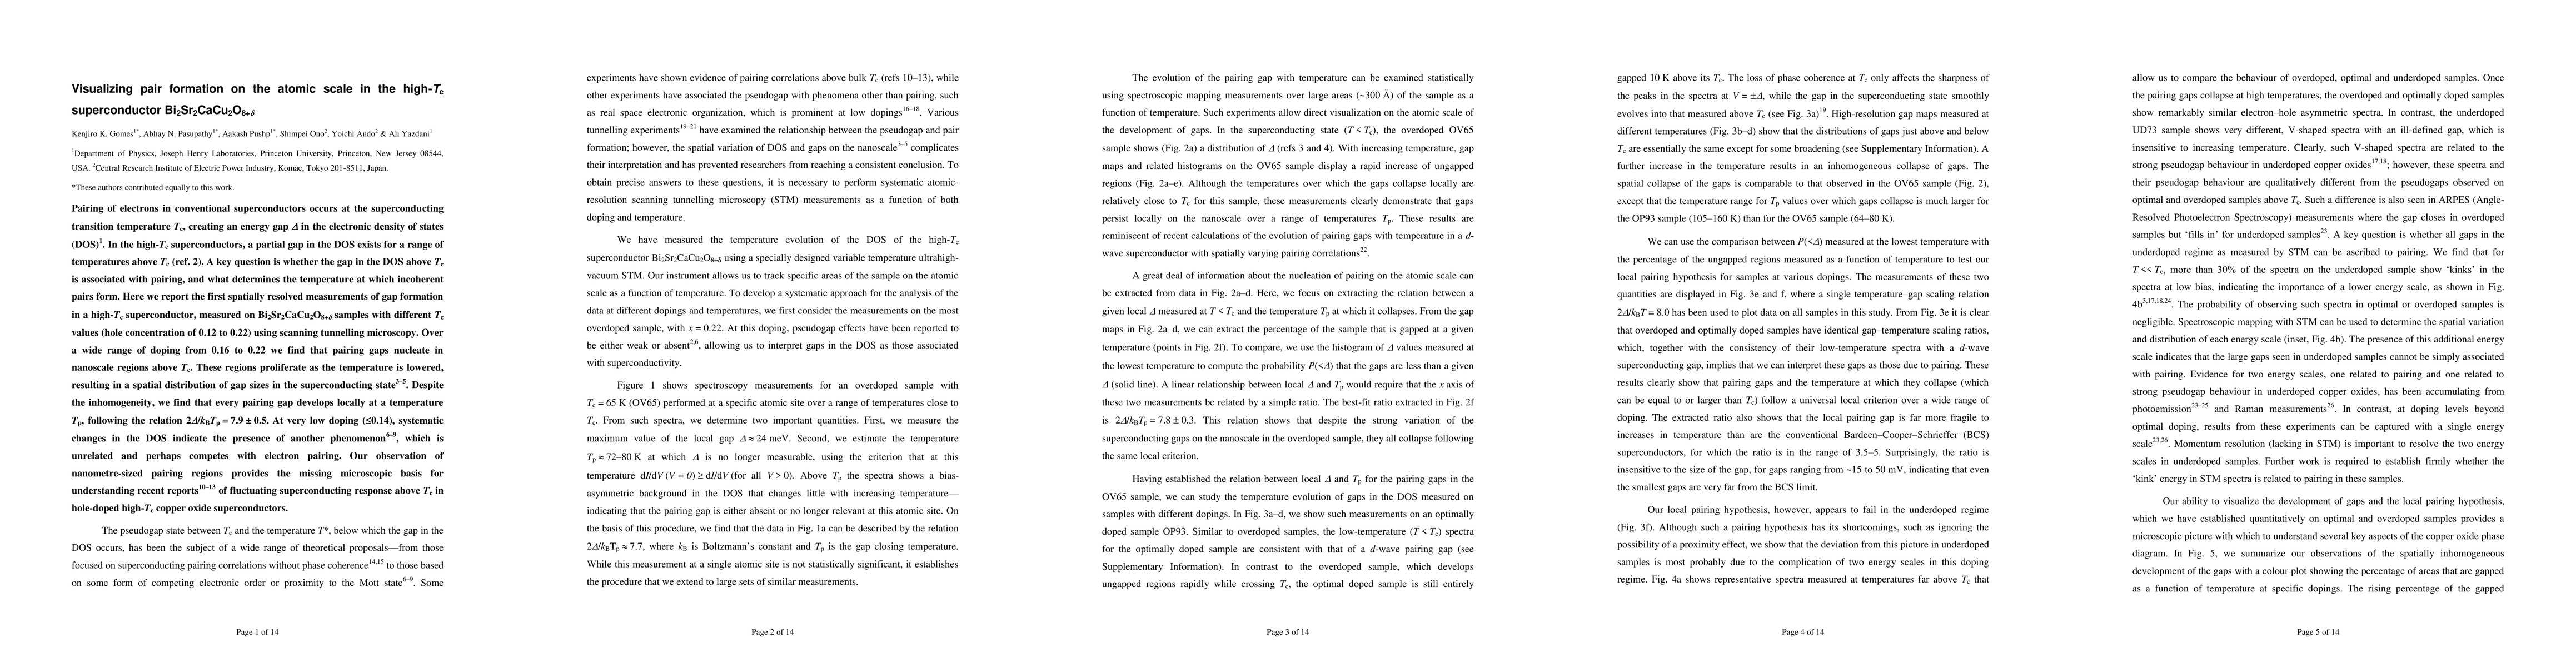
Pairing of electrons in conventional superconductors occurs at the superconducting transition temperature Tc, creating an energy gap D in the electronic density of states (DOS). In the high-Tc superconductors, a partial gap in the DOS exists for a range of temperatures above Tc. A key question is whether the gap in the DOS above Tc is associated with pairing, and what determines the temperature at which incoherent pairs form. Here we report the first spatially resolved measurements of gap formation in a high-Tc superconductor, measured on Bi2Sr2CaCu2O8+d samples with different Tc values (hole concentration of 0.12 to 0.22) using scanning tunnelling microscopy. Over a wide range of doping from 0.16 to 0.22 we find that pairing gaps nucleate in nanoscale regions above Tc. These regions proliferate as the temperature is lowered, resulting in a spatial distribution of gap sizes in the superconducting state. Despite the inhomogeneity, we find that every pairing gap develops locally at a temperature Tp, following the relation 2D/kBTp = 8. At very low doping (<0.14), systematic changes in the DOS indicate the presence of another phenomenon, which is unrelated and perhaps competes with electron pairing. Our observation of nanometre-sized pairing regions provides the missing microscopic basis for understanding recent reports of fluctuating superconducting response above Tc in hole-doped high-Tc copper oxide superconductors.
AI Key Findings
Get AI-generated insights about this paper's methodology, results, significance, and more — seven facets brought into focus.
Impact
Paper Details
PDF Preview
Key Terms
Citation Network
Current paper (gray), citations (green), references (blue)
Display is limited for performance on very large graphs.
Discussion 0