Publication
Metrics
AI Quick Summary
This paper proposes a novel visualization technique using nonlinear dimensionality reduction and unsupervised machine learning to identify quantum phases and transitions in complex systems. By mapping quantum states in Hilbert space to a two-dimensional feature space, it can directly specify distinct phases and identify phase transitions without prior knowledge of order parameters.
Paper Preview
Abstract
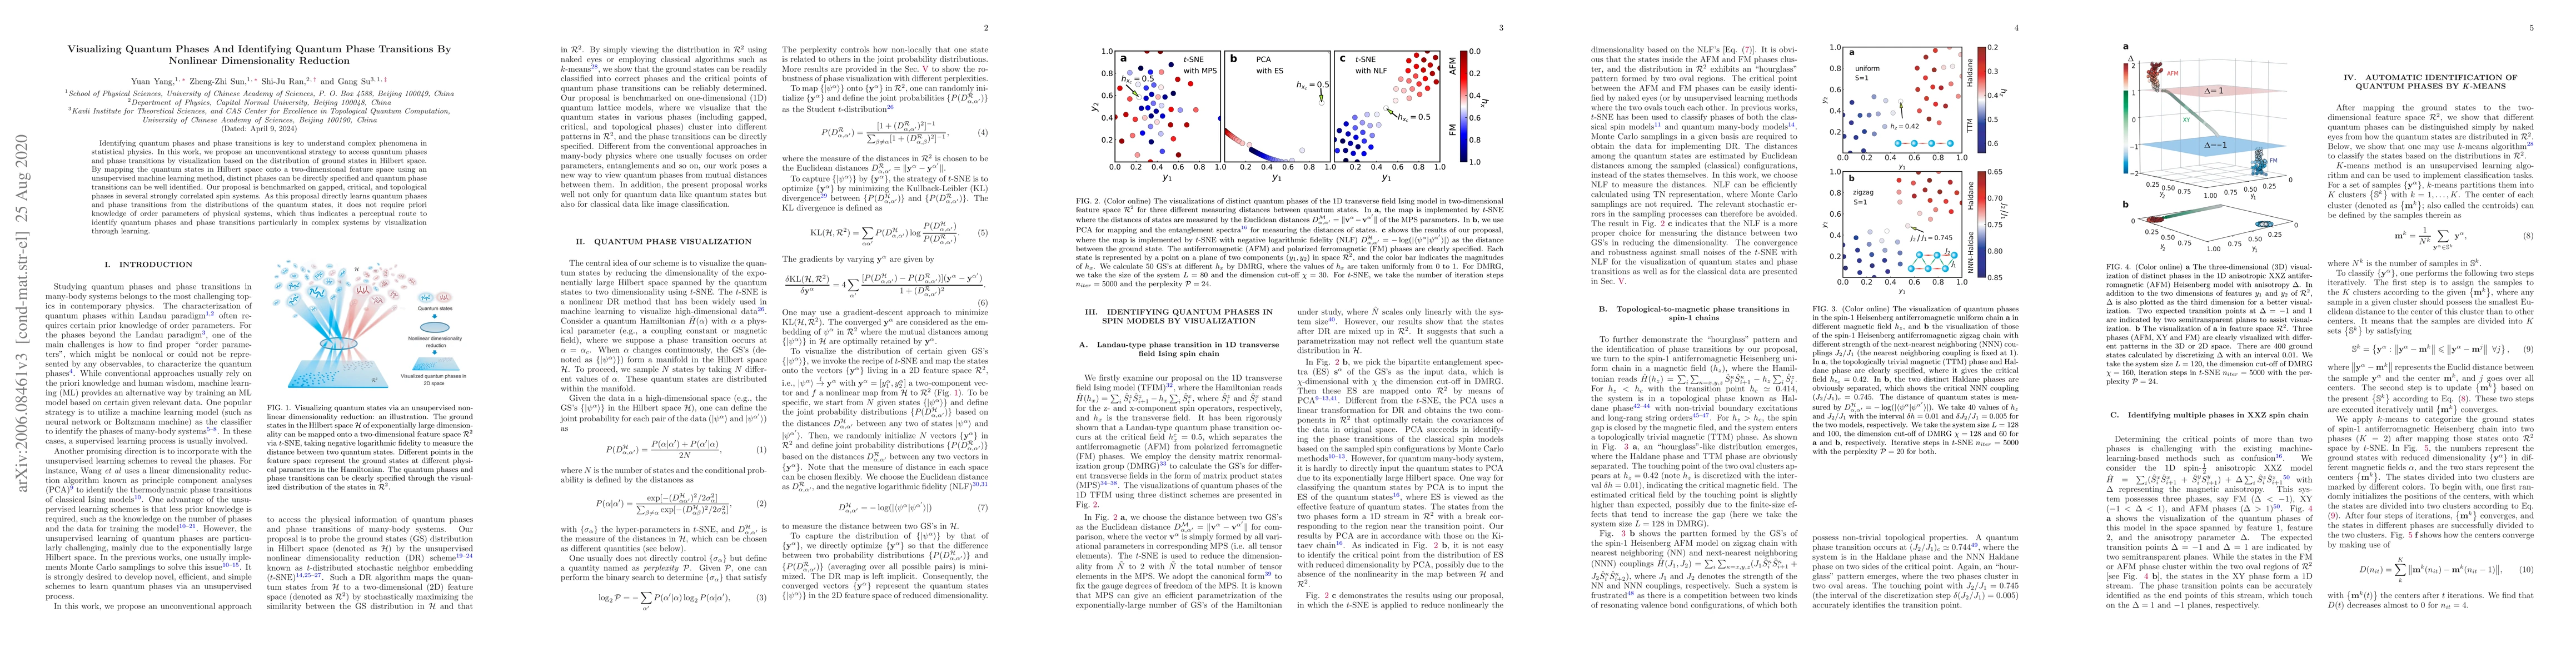
Identifying quantum phases and phase transitions is key to understand complex phenomena in statistical physics. In this work, we propose an unconventional strategy to access quantum phases and phase transitions by visualization based on the distribution of ground states in Hilbert space. By mapping the quantum states in Hilbert space onto a two-dimensional feature space using an unsupervised machine learning method, distinct phases can be directly specified and quantum phase transitions can be well identified. Our proposal is benchmarked on gapped, critical, and topological phases in several strongly correlated spin systems. As this proposal directly learns quantum phases and phase transitions from the distributions of the quantum states, it does not require priori knowledge of order parameters of physical systems, which thus indicates a perceptual route to identify quantum phases and phase transitions particularly in complex systems by visualization through learning.
AI Key Findings
Get AI-generated insights about this paper's methodology, results, significance, and more — seven facets brought into focus.
Impact
Paper Details
PDF Preview
Key Terms
Citation Network
Current paper (gray), citations (green), references (blue)
Display is limited for performance on very large graphs.
Discussion 0