Visualizing Routes with AI-Discovered Street-View Patterns
Publication
Metrics
AI Quick Summary
This paper proposes AI techniques to quantify visual street-level features using semantic latent vectors and discovers spatial imagery patterns to enhance route planning visualization. VivaRoutes, an interactive prototype, integrates these patterns to help users explore routes more effectively, supported by a user study assessing its utility.
Paper Preview
Abstract
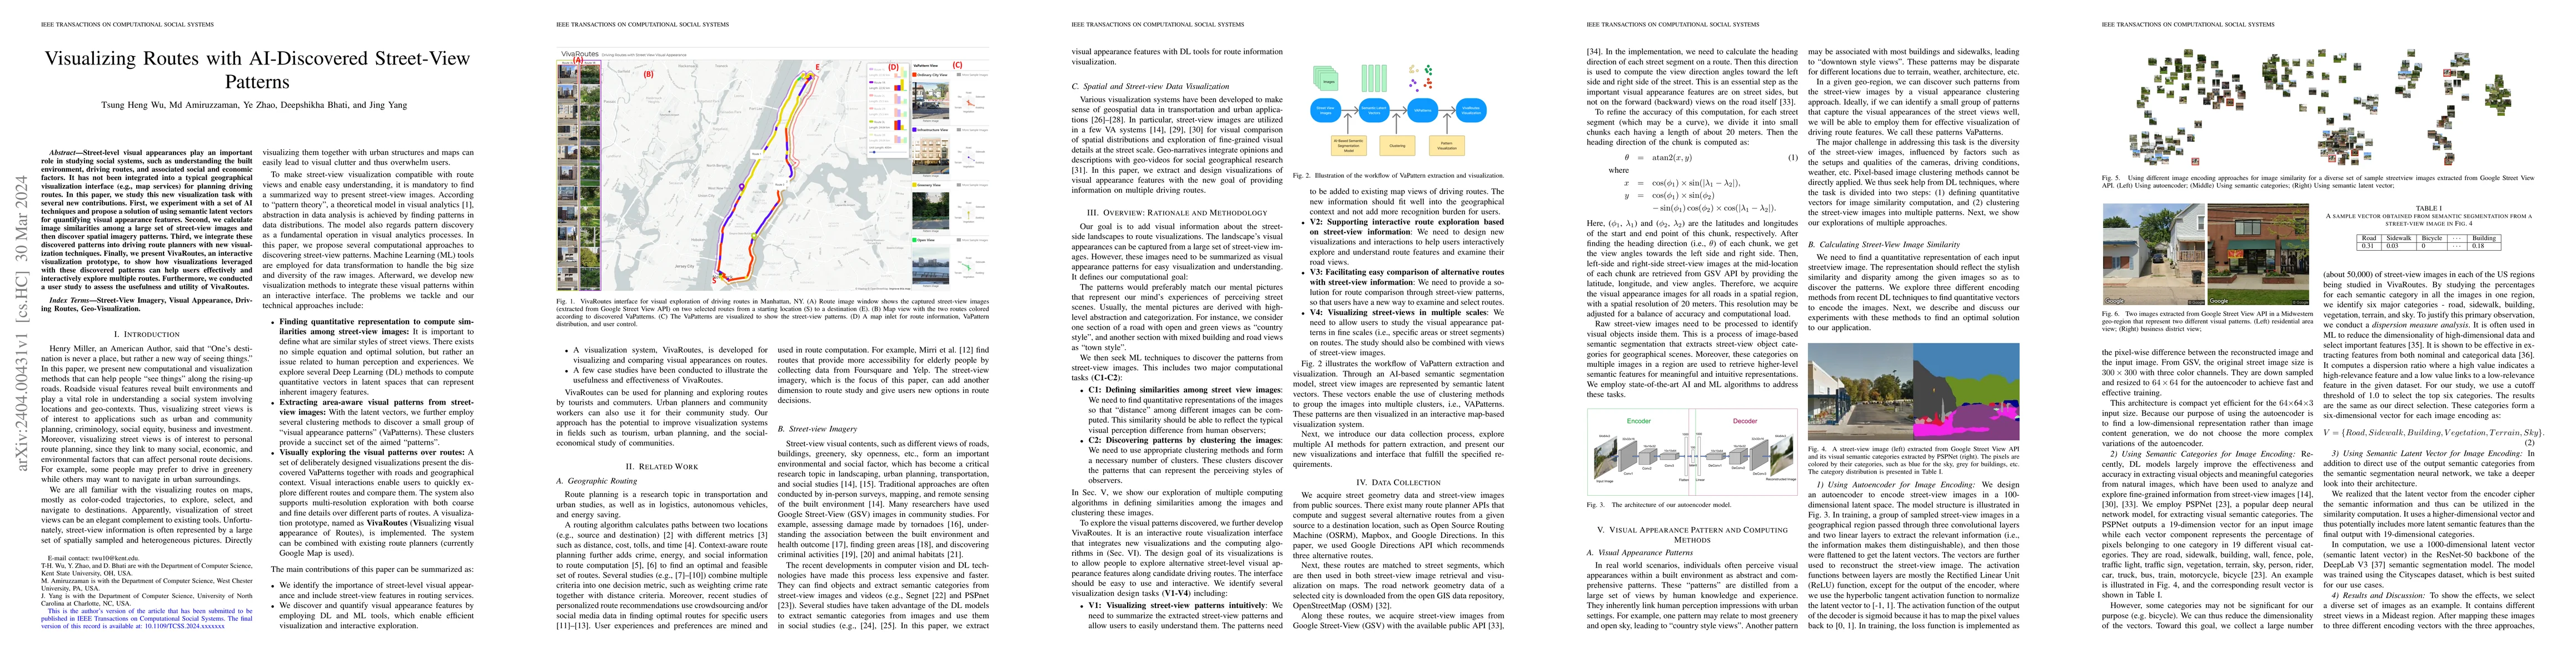
Street-level visual appearances play an important role in studying social systems, such as understanding the built environment, driving routes, and associated social and economic factors. It has not been integrated into a typical geographical visualization interface (e.g., map services) for planning driving routes. In this paper, we study this new visualization task with several new contributions. First, we experiment with a set of AI techniques and propose a solution of using semantic latent vectors for quantifying visual appearance features. Second, we calculate image similarities among a large set of street-view images and then discover spatial imagery patterns. Third, we integrate these discovered patterns into driving route planners with new visualization techniques. Finally, we present VivaRoutes, an interactive visualization prototype, to show how visualizations leveraged with these discovered patterns can help users effectively and interactively explore multiple routes. Furthermore, we conducted a user study to assess the usefulness and utility of VivaRoutes.
AI Key Findings
Get AI-generated insights about this paper's methodology, results, significance, and more — seven facets brought into focus.
Impact
Paper Details
Authors
PDF Preview
Key Terms
Citation Network
Current paper (gray), citations (green), references (blue)
Display is limited for performance on very large graphs.
Discussion 0