Publication
Metrics
AI Quick Summary
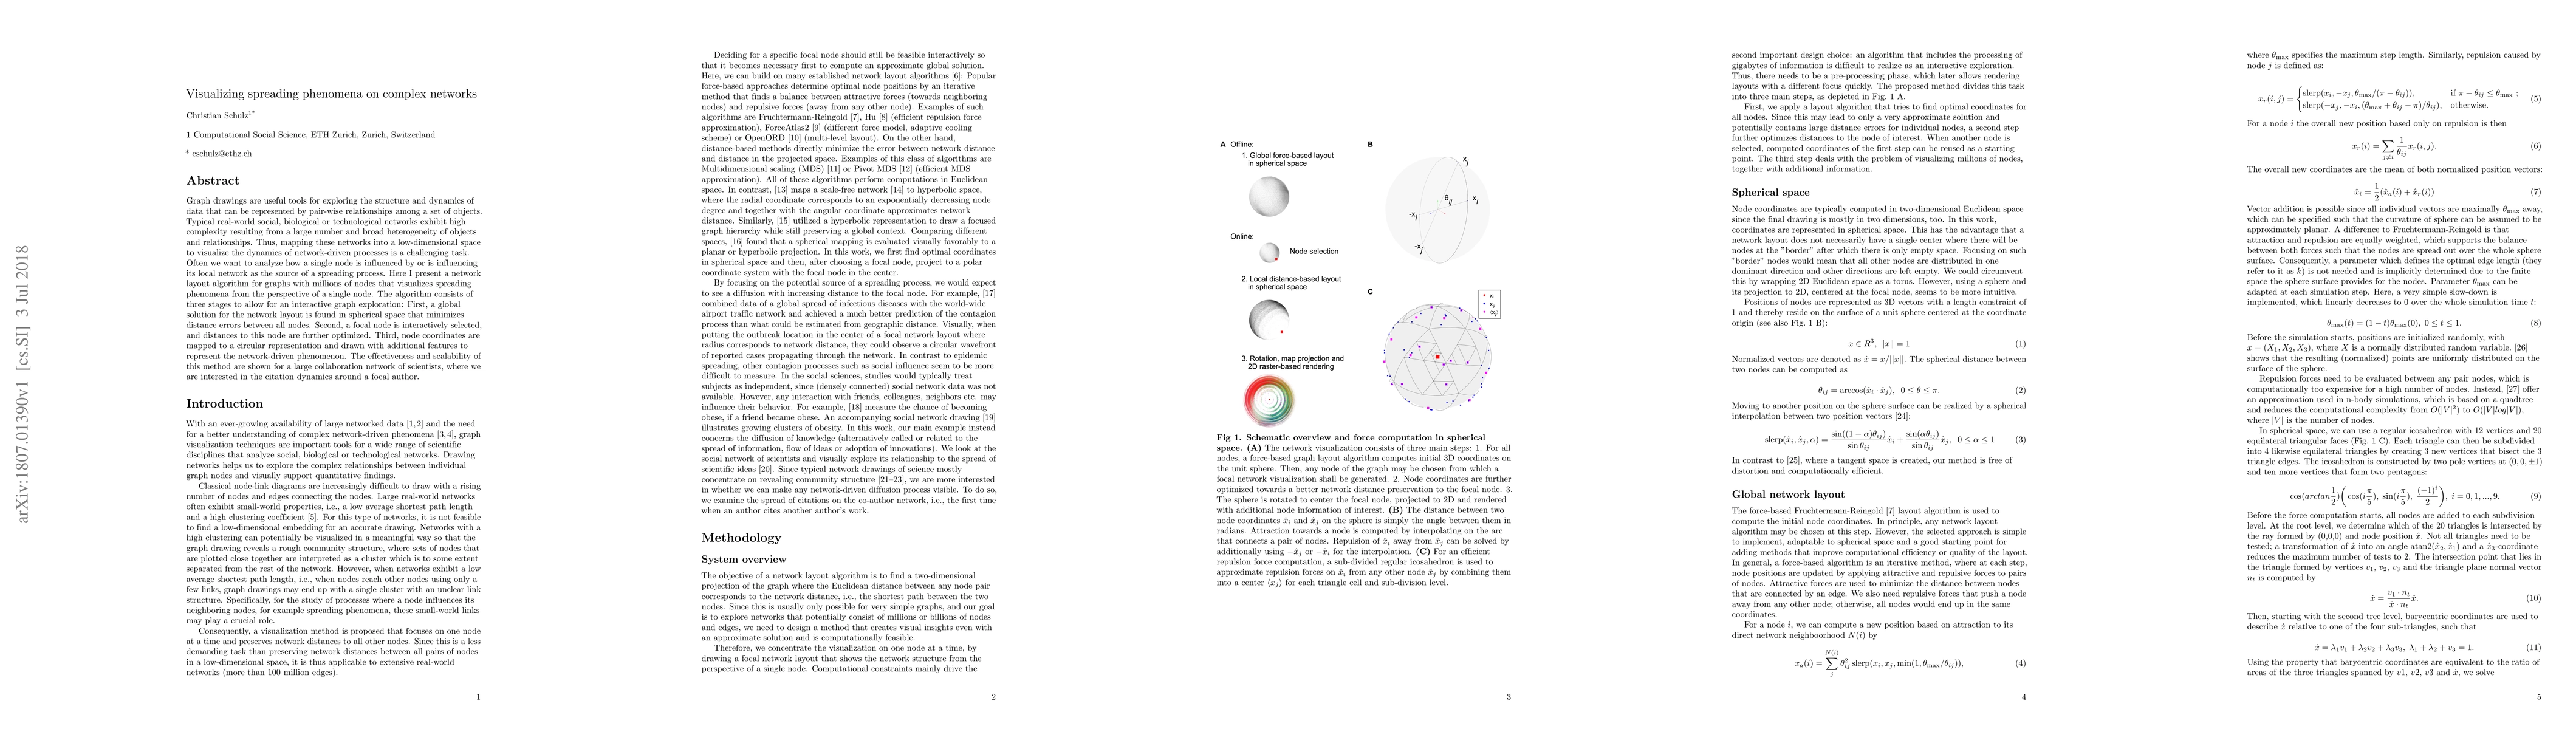
A new algorithm visualizes spreading phenomena on complex networks by mapping nodes to a circular representation, allowing for interactive exploration of the network's dynamics around a focal node. The method is scalable and effective in analyzing citation dynamics in a large collaboration network.
Paper Preview
Abstract
Graph drawings are useful tools for exploring the structure and dynamics of data that can be represented by pair-wise relationships among a set of objects. Typical real-world social, biological or technological networks exhibit high complexity resulting from a large number and broad heterogeneity of objects and relationships. Thus, mapping these networks into a low-dimensional space to visualize the dynamics of network-driven processes is a challenging task. Often we want to analyze how a single node is influenced by or is influencing its local network as the source of a spreading process. Here I present a network layout algorithm for graphs with millions of nodes that visualizes spreading phenomena from the perspective of a single node. The algorithm consists of three stages to allow for an interactive graph exploration: First, a global solution for the network layout is found in spherical space that minimizes distance errors between all nodes. Second, a focal node is interactively selected, and distances to this node are further optimized. Third, node coordinates are mapped to a circular representation and drawn with additional features to represent the network-driven phenomenon. The effectiveness and scalability of this method are shown for a large collaboration network of scientists, where we are interested in the citation dynamics around a focal author.
AI Key Findings
Get AI-generated insights about this paper's methodology, results, significance, and more — seven facets brought into focus.
Impact
Paper Details
PDF Preview
Key Terms
Citation Network
Current paper (gray), citations (green), references (blue)
Display is limited for performance on very large graphs.
Discussion 0