Publication
Metrics
AI Quick Summary
This paper introduces graphical methods for testing the equality of covariance matrices in multivariate linear models, particularly in MANOVA settings. It proposes extensions of data ellipsoids, hypothesis-error plots, and canonical discriminant plots, along with a new visualization for Box's M test, and provides these tools in R packages **heplots** and **candisc**.
Paper Preview
Abstract
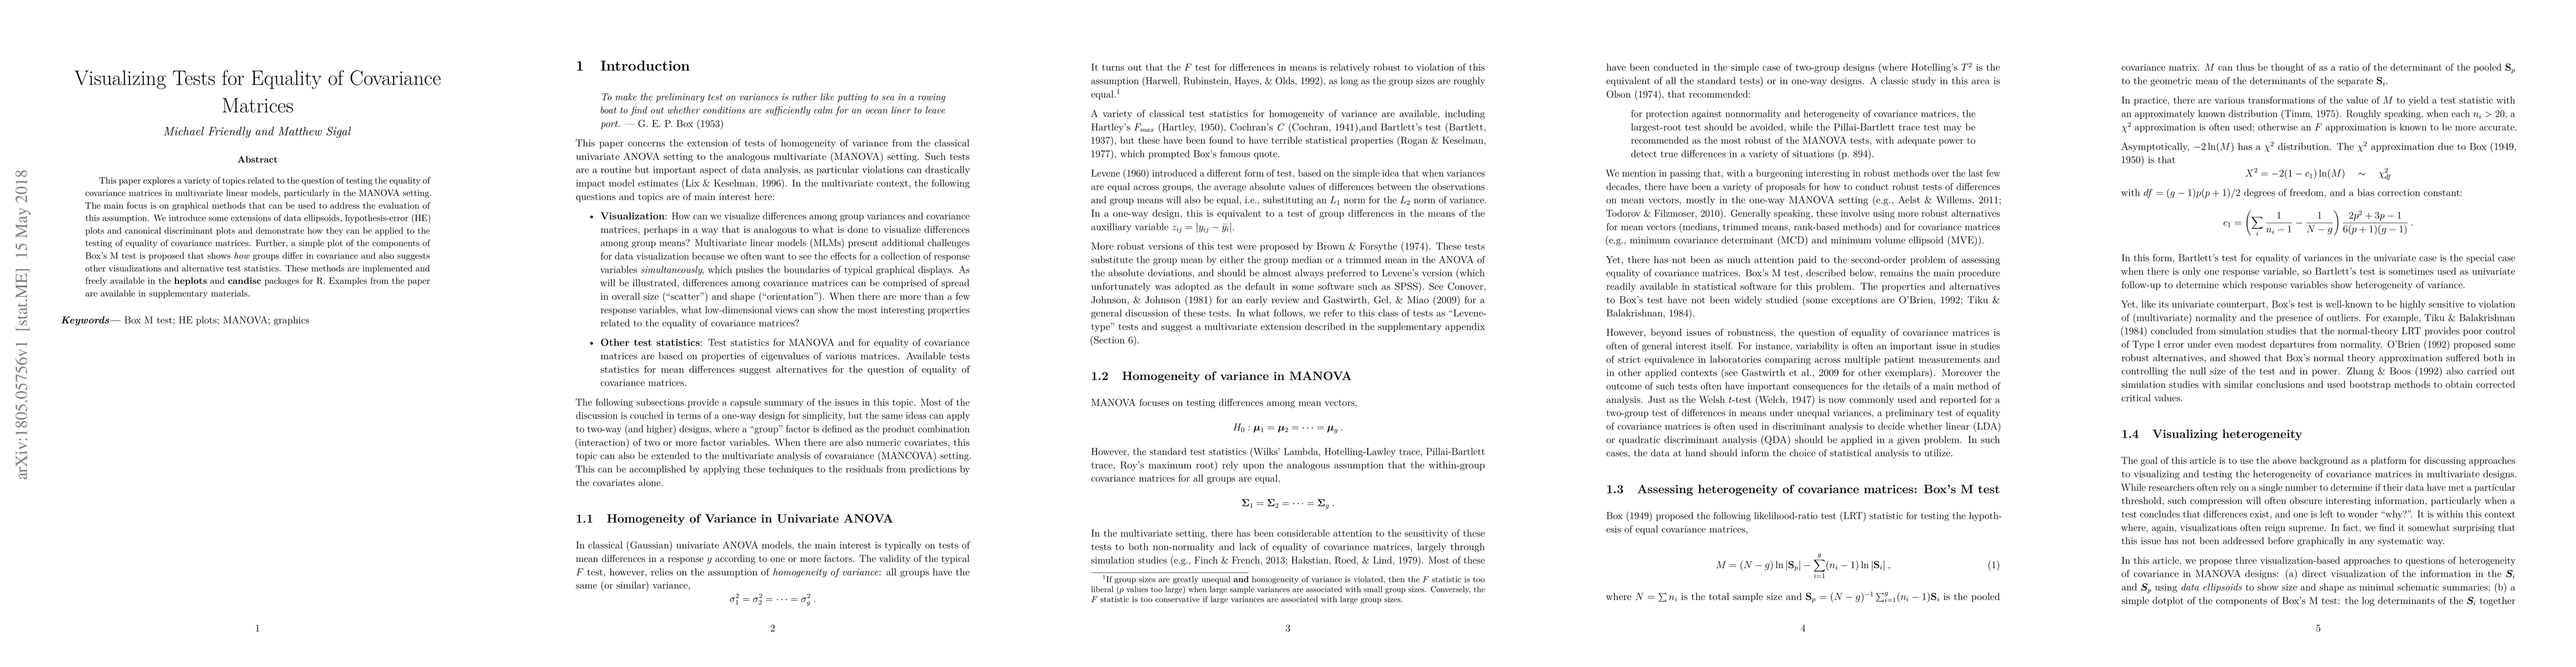
This paper explores a variety of topics related to the question of testing the equality of covariance matrices in multivariate linear models, particularly in the MANOVA setting. The main focus is on graphical methods that can be used to address the evaluation of this assumption. We introduce some extensions of data ellipsoids, hypothesis-error (HE) plots and canonical discriminant plots and demonstrate how they can be applied to the testing of equality of covariance matrices. Further, a simple plot of the components of Box's M test is proposed that shows _how_ groups differ in covariance and also suggests other visualizations and alternative test statistics. These methods are implemented and freely available in the **heplots** and **candisc** packages for R. Examples from the paper are available in supplementary materials.
AI Key Findings
Get AI-generated insights about this paper's methodology, results, significance, and more — seven facets brought into focus.
Impact
Paper Details
PDF Preview
Key Terms
Citation Network
Current paper (gray), citations (green), references (blue)
Display is limited for performance on very large graphs.
Discussion 0