Visualizing textual models with in-text and word-as-pixel highlighting
Publication
Metrics
Paper Preview
Abstract
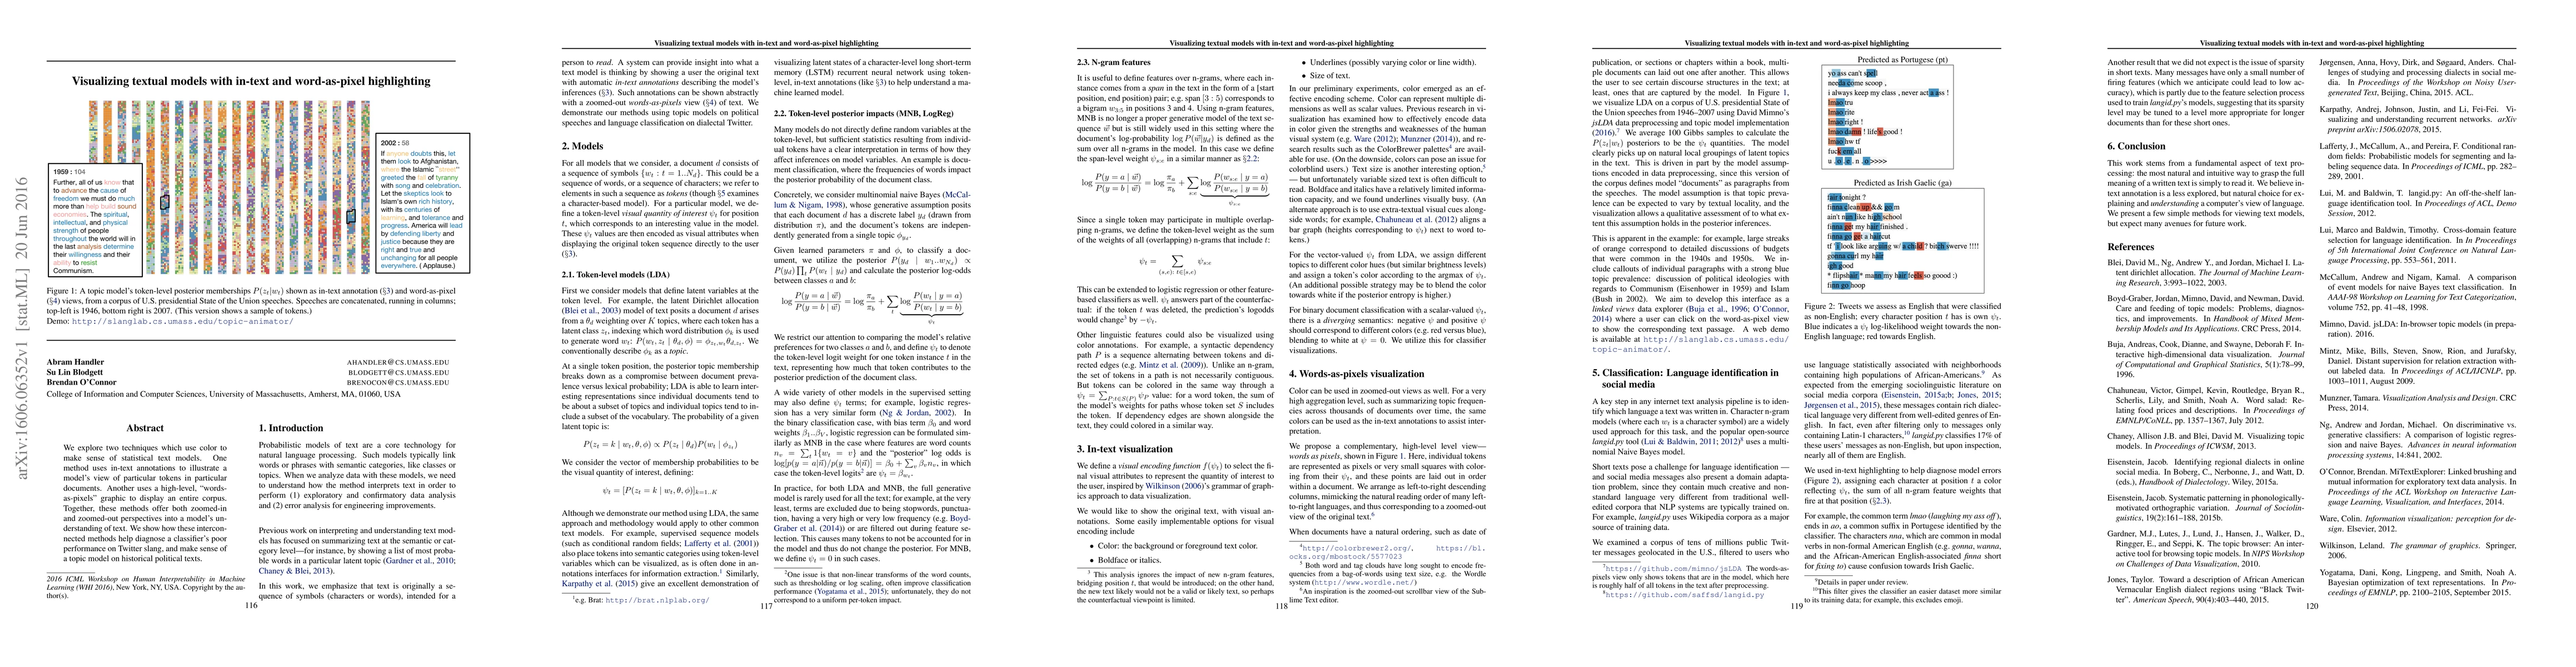
We explore two techniques which use color to make sense of statistical text models. One method uses in-text annotations to illustrate a model's view of particular tokens in particular documents. Another uses a high-level, "words-as-pixels" graphic to display an entire corpus. Together, these methods offer both zoomed-in and zoomed-out perspectives into a model's understanding of text. We show how these interconnected methods help diagnose a classifier's poor performance on Twitter slang, and make sense of a topic model on historical political texts.
AI Key Findings
Get AI-generated insights about this paper's methodology, results, significance, and more — seven facets brought into focus.
Impact
Paper Details
PDF Preview
Key Terms
Citation Network
Current paper (gray), citations (green), references (blue)
Display is limited for performance on very large graphs.
Discussion 0