Publication
Metrics
AI Quick Summary
This paper introduces a new visualization method called the survival area plot to depict the effect of continuous variables on time-to-event outcomes, using g-computation for causal interpretation. The proposed method is demonstrated and compared to traditional survival curves using data from a German observational study on the Ankle Brachial Index.
Paper Preview
Abstract
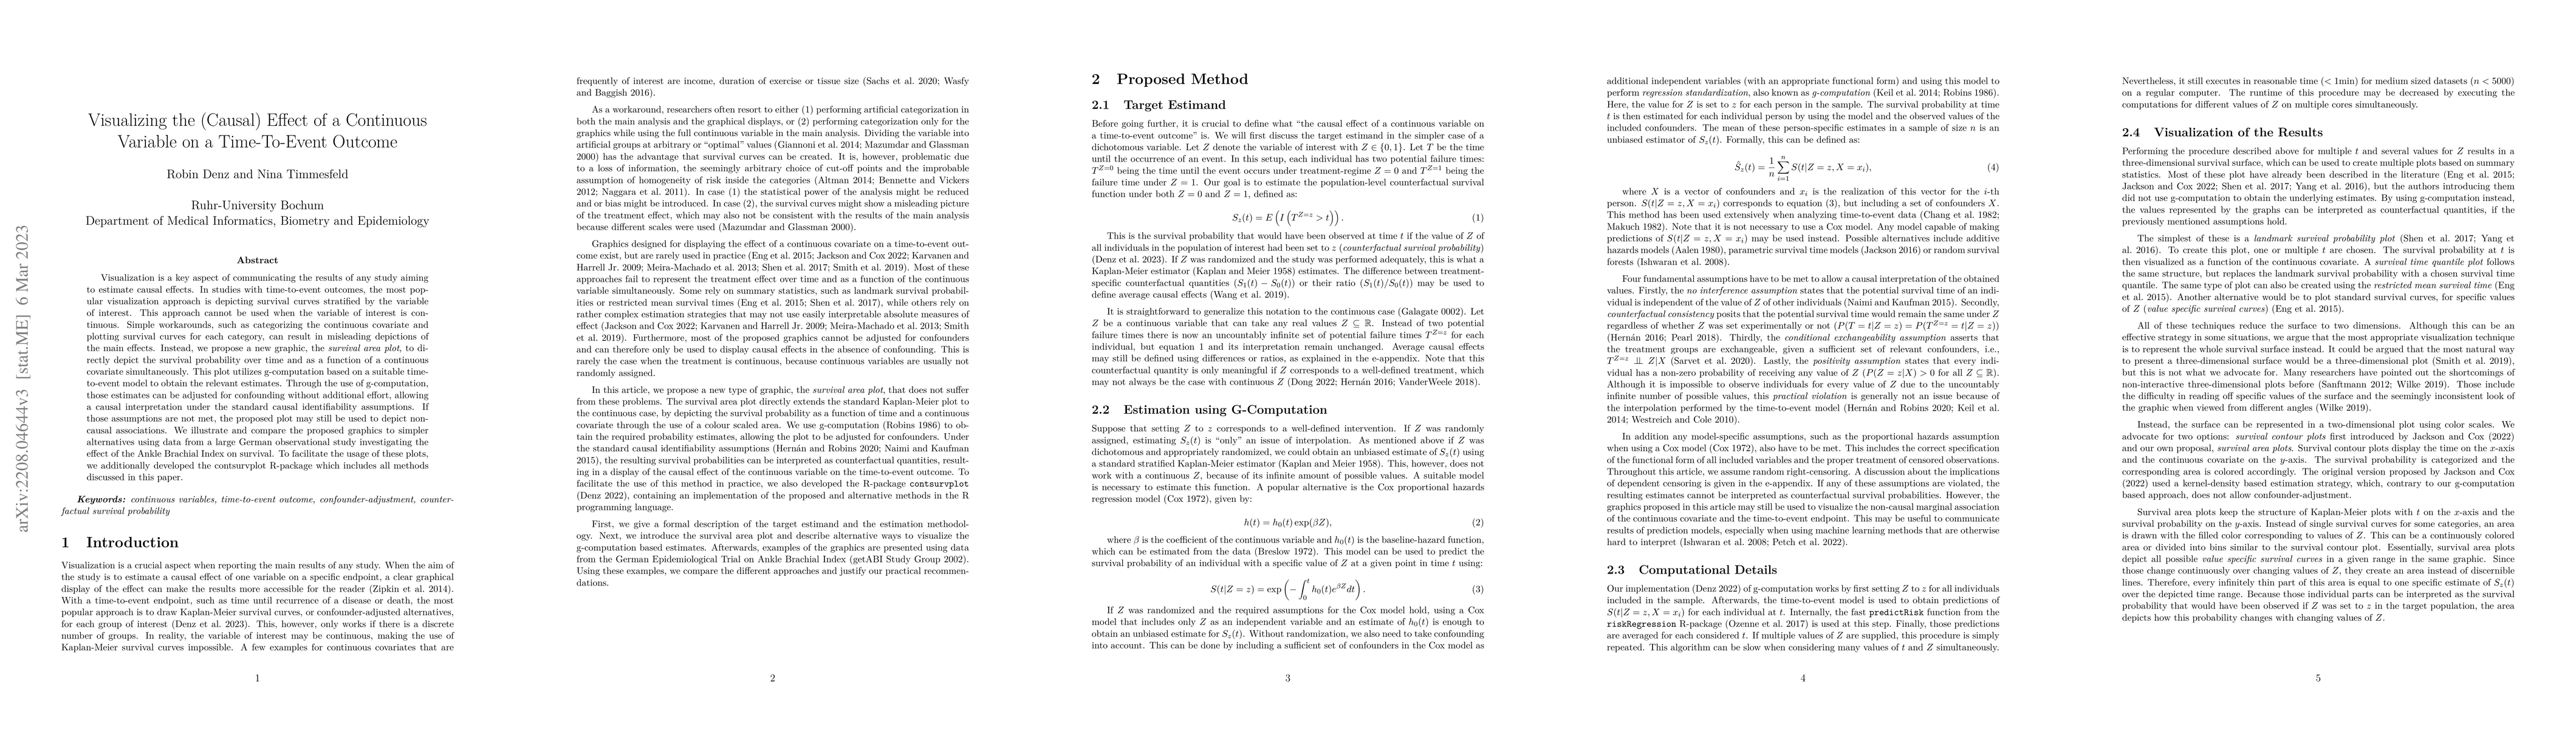
Visualization is a key aspect of communicating the results of any study aiming to estimate causal effects. In studies with time-to-event outcomes, the most popular visualization approach is depicting survival curves stratified by the variable of interest. This approach cannot be used when the variable of interest is continuous. Simple workarounds, such as categorizing the continuous covariate and plotting survival curves for each category, can result in misleading depictions of the main effects. Instead, we propose a new graphic, the survival area plot, to directly depict the survival probability over time and as a function of a continuous covariate simultaneously. This plot utilizes g-computation based on a suitable time-to-event model to obtain the relevant estimates. Through the use of g-computation, those estimates can be adjusted for confounding without additional effort, allowing a causal interpretation under the standard causal identifiability assumptions. If those assumptions are not met, the proposed plot may still be used to depict noncausal associations. We illustrate and compare the proposed graphics to simpler alternatives using data from a large German observational study investigating the effect of the Ankle Brachial Index on survival. To facilitate the usage of these plots, we additionally developed the contsurvplot R-package which includes all methods discussed in this paper.
AI Key Findings
Get AI-generated insights about this paper's methodology, results, significance, and more — seven facets brought into focus.
Impact
Paper Details
Authors
PDF Preview
Key Terms
Citation Network
Current paper (gray), citations (green), references (blue)
Display is limited for performance on very large graphs.
Discussion 0