Visualizing the geometry of labeled high-dimensional data with spheres
Publication
Metrics
Paper Preview
Abstract
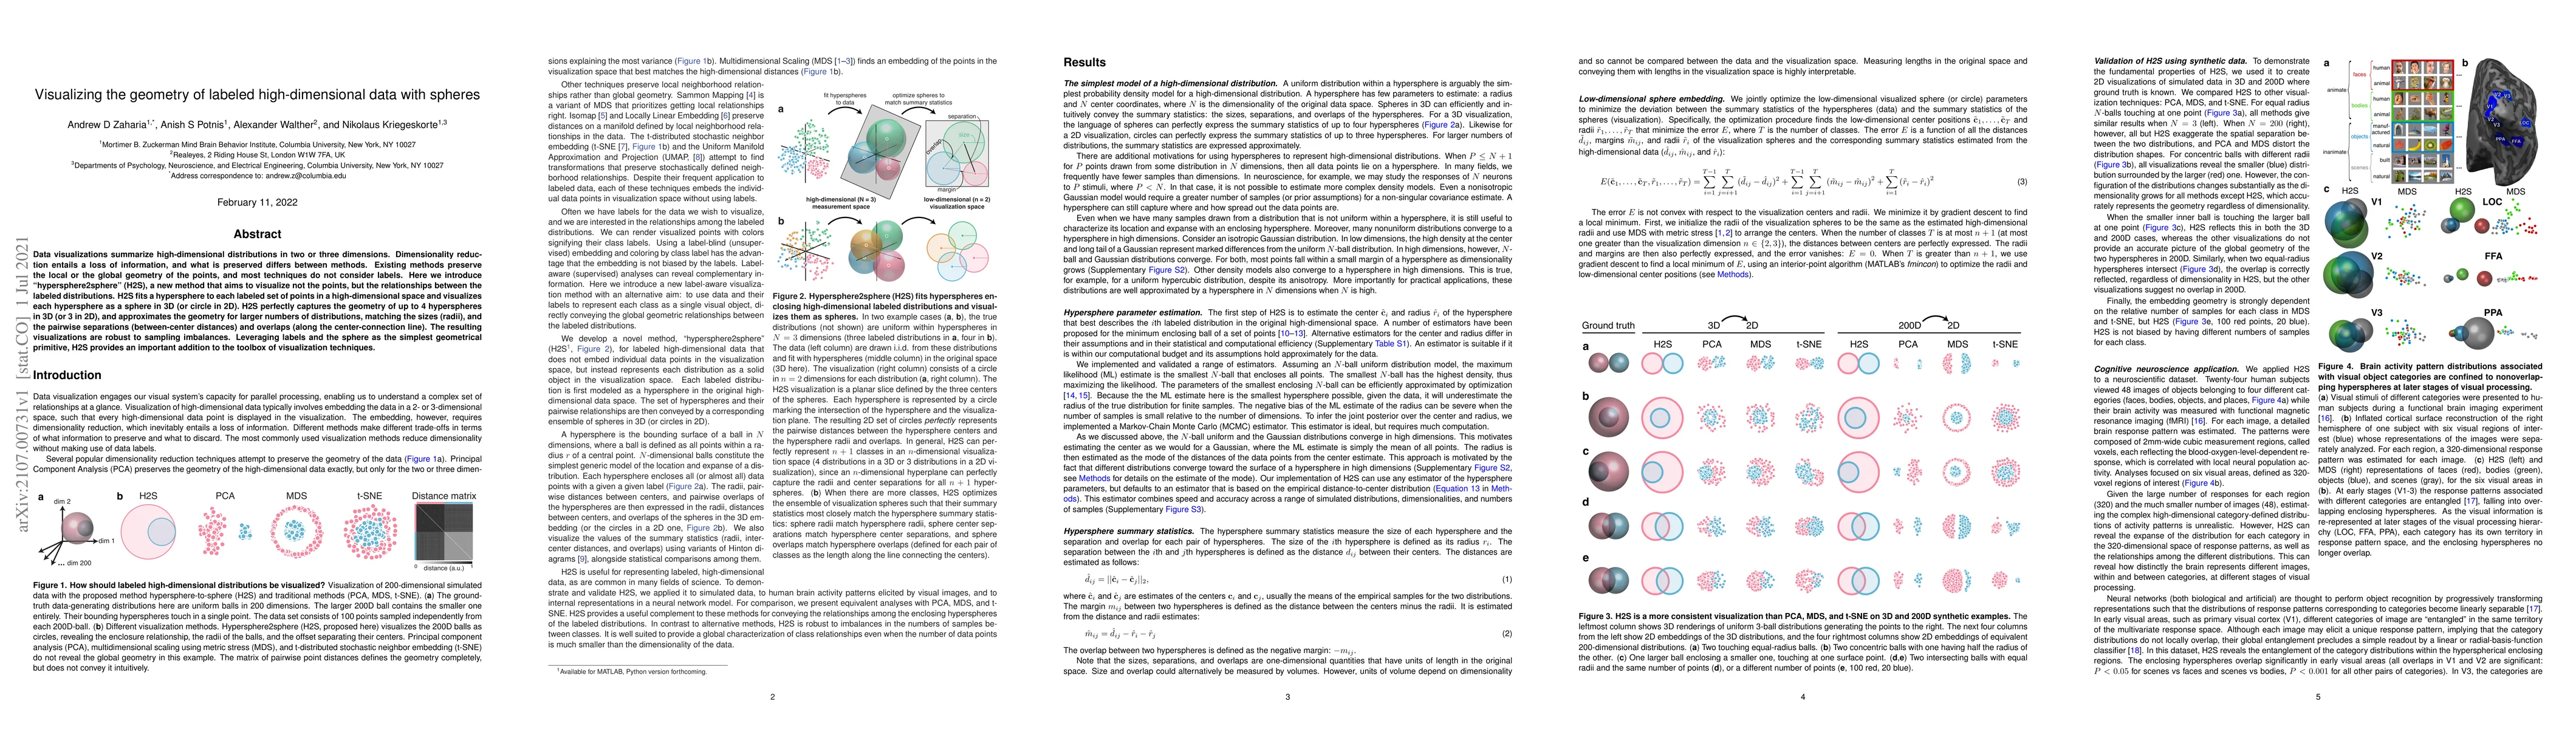
Data visualizations summarize high-dimensional distributions in two or three dimensions. Dimensionality reduction entails a loss of information, and what is preserved differs between methods. Existing methods preserve the local or the global geometry of the points, and most techniques do not consider labels. Here we introduce "hypersphere2sphere" (H2S), a new method that aims to visualize not the points, but the relationships between the labeled distributions. H2S fits a hypersphere to each labeled set of points in a high-dimensional space and visualizes each hypersphere as a sphere in 3D (or circle in 2D). H2S perfectly captures the geometry of up to 4 hyperspheres in 3D (or 3 in 2D), and approximates the geometry for larger numbers of distributions, matching the sizes (radii), and the pairwise separations (between-center distances) and overlaps (along the center-connection line). The resulting visualizations are robust to sampling imbalances. Leveraging labels and the sphere as the simplest geometrical primitive, H2S provides an important addition to the toolbox of visualization techniques.
AI Key Findings
Get AI-generated insights about this paper's methodology, results, significance, and more — seven facets brought into focus.
Impact
Paper Details
Authors
PDF Preview
Key Terms
Citation Network
Current paper (gray), citations (green), references (blue)
Display is limited for performance on very large graphs.
Discussion 0