Publication
Metrics
AI Quick Summary
Researchers created graphical representations to visualize unstable subatomic particles' mass and width spectrum, helping students understand complex data in an alternate way.
Paper Preview
Abstract
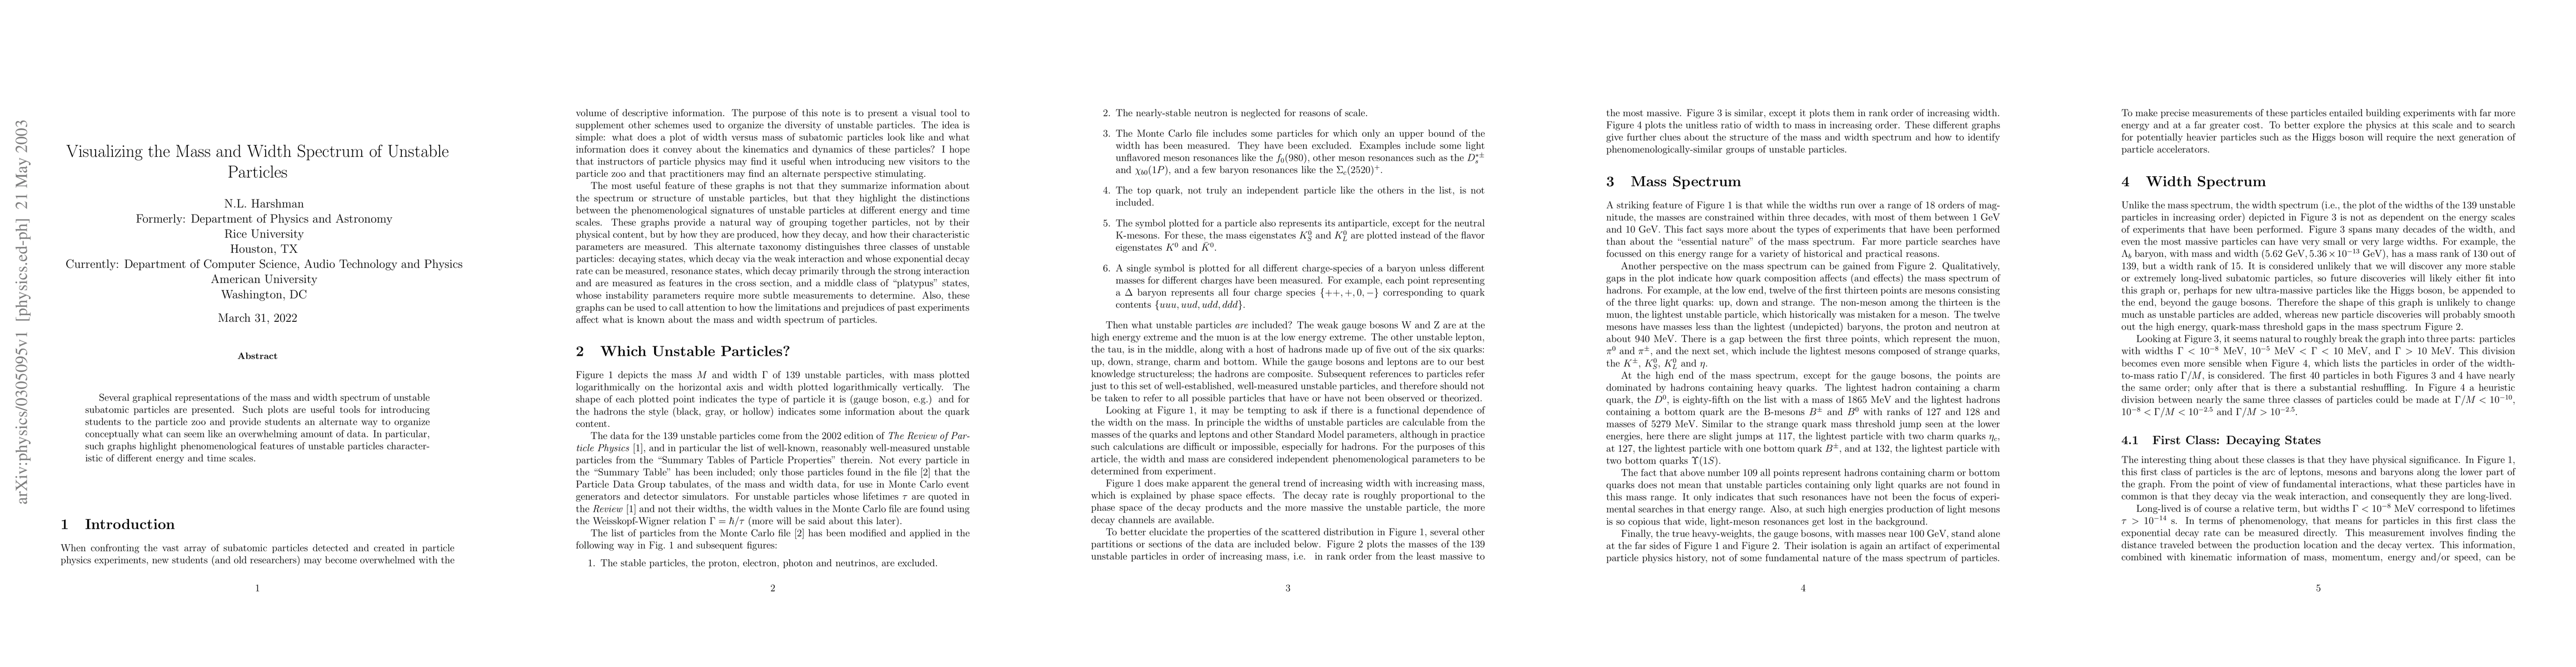
Several graphical representations of the mass and width spectrum of unstable subatomic particles are presented. Such plots are useful tools for introducing students to the particle zoo and provide students an alternate way to organize conceptually what can seem like an overwhelming amount of data. In particular, such graphs highlight phenomenological features of unstable particles characteristic of different energy and time scales.
AI Key Findings
Get AI-generated insights about this paper's methodology, results, significance, and more — seven facets brought into focus.
Impact
Paper Details
Authors
PDF Preview
Citation Network
Current paper (gray), citations (green), references (blue)
Display is limited for performance on very large graphs.
Discussion 0