Visualizing the Process of Process Modeling with PPMCharts
Publication
Metrics
AI Quick Summary
Researchers developed a tool to visualize the process of process modeling, allowing for the discovery of patterns and different views on the process. The study provides new insights into how process models are created, enabling better understanding and improvement of process modeling techniques.
Paper Preview
Abstract
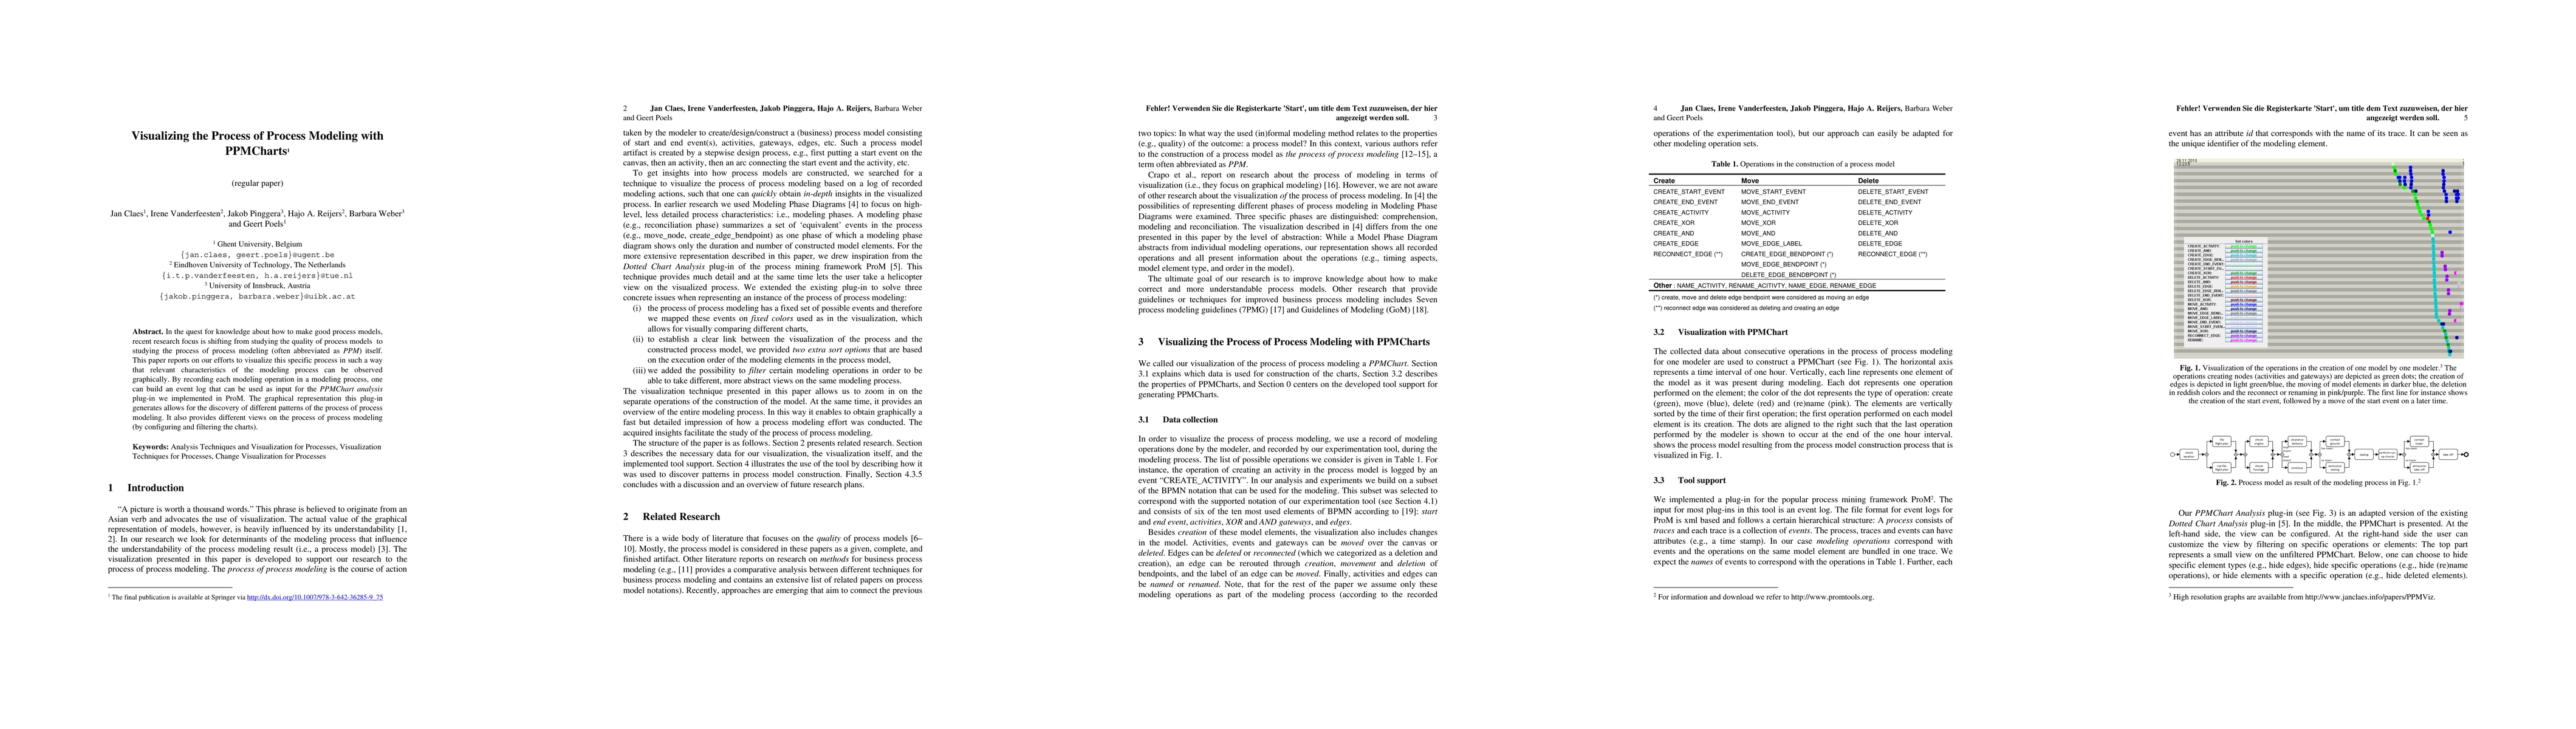
In the quest for knowledge about how to make good process models, recent research focus is shifting from studying the quality of process models to studying the process of process modeling (often abbreviated as PPM) itself. This paper reports on our efforts to visualize this specific process in such a way that relevant characteristics of the modeling process can be observed graphically. By recording each modeling operation in a modeling process, one can build an event log that can be used as input for the PPMChart Analysis plug-in we implemented in ProM. The graphical representation this plug-in generates allows for the discovery of different patterns of the process of process modeling. It also provides different views on the process of process modeling (by configuring and filtering the charts).
AI Key Findings
Get AI-generated insights about this paper's methodology, results, significance, and more — seven facets brought into focus.
Impact
Paper Details
PDF Preview
Key Terms
Citation Network
Current paper (gray), citations (green), references (blue)
Display is limited for performance on very large graphs.
Discussion 0