AI Quick Summary
This paper reevaluates the traditional $P\dot P$ diagram for visualizing pulsars, finding that $P$ and $\dot P$ alone are insufficient to describe the pulsar population's diversity. It proposes a pulsar tree approach based on a minimum spanning tree, offering a more nuanced view of pulsar similarities beyond period and period derivative.
Paper Preview
Abstract
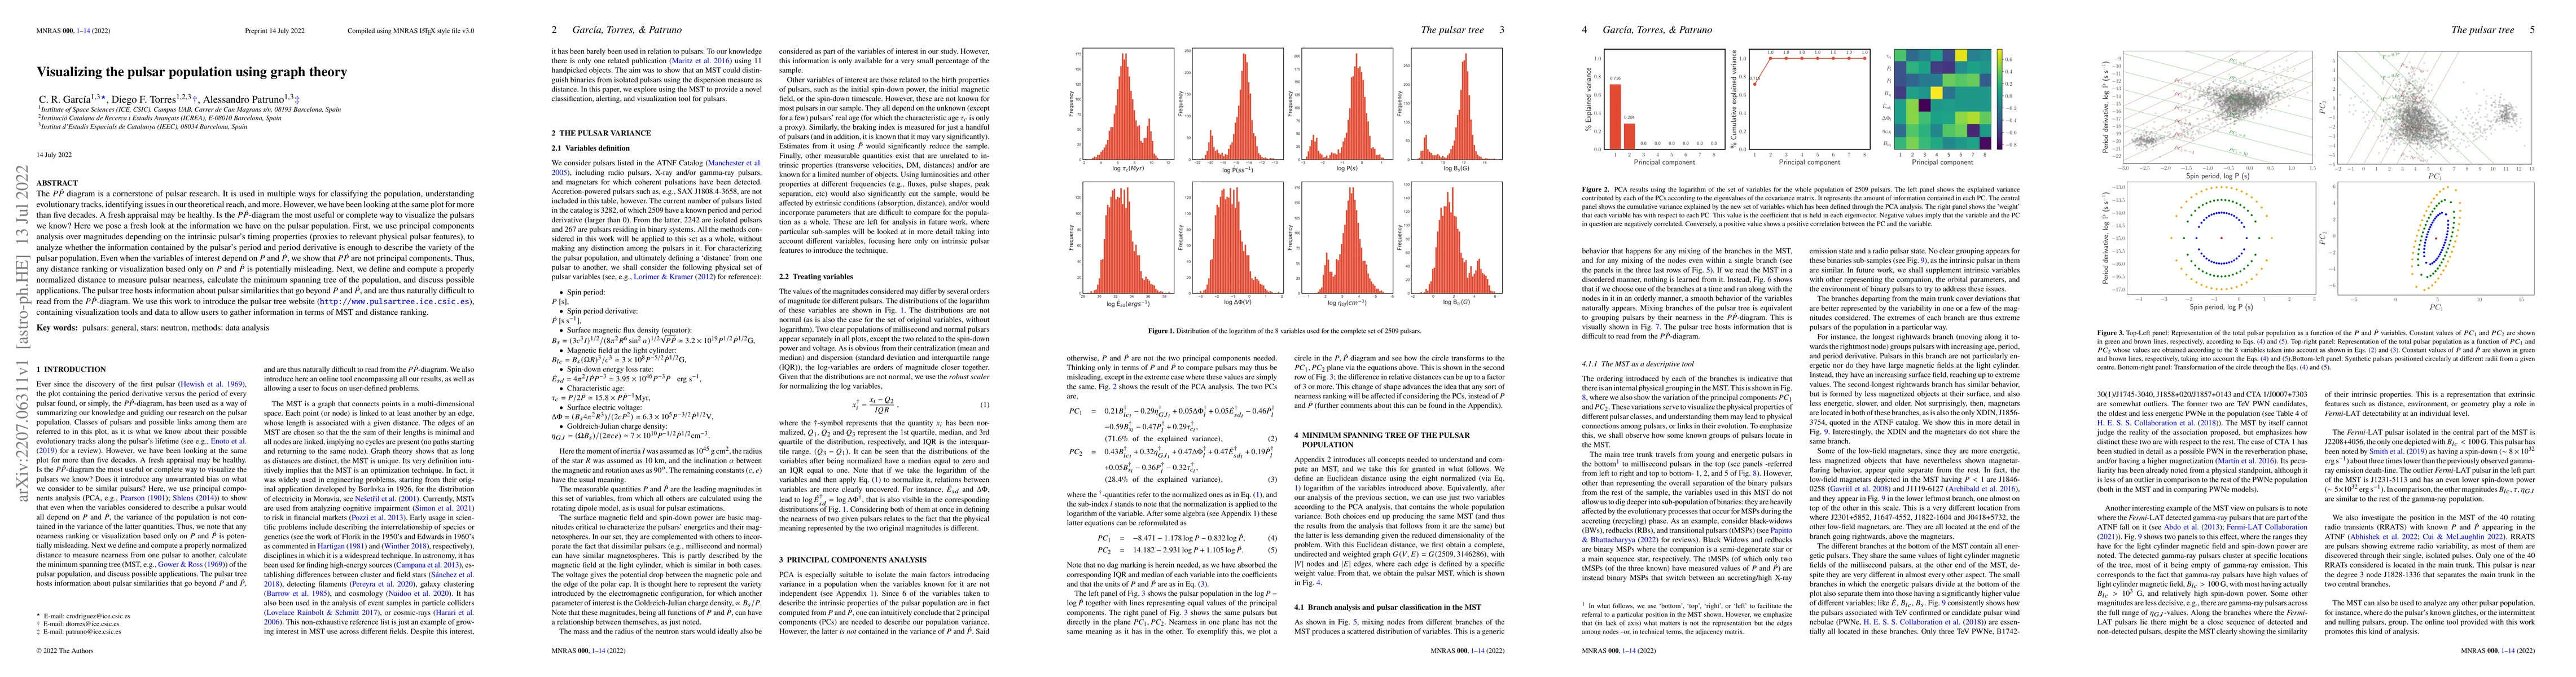
The $P\dot P$ diagram is a cornerstone of pulsar research. It is used in multiple ways for classifying the population, understanding evolutionary tracks, identifying issues in our theoretical reach, and more. However, we have been looking at the same plot for more than five decades. A fresh appraisal may be healthy. Is the $P\dot P$-diagram the most useful or complete way to visualize the pulsars we know? Here we pose a fresh look at the information we have on the pulsar population. First, we use principal components analysis over magnitudes depending on the intrinsic pulsar's timing properties (proxies to relevant physical pulsar features), to analyze whether the information contained by the pulsar's period and period derivative is enough to describe the variety of the pulsar population. Even when the variables of interest depend on $P$ and $\dot P$, we show that $P\dot P$ are not principal components. Thus, any distance ranking or visualization based only on $P$ and $\dot P$ is potentially misleading. Next, we define and compute a properly normalized distance to measure pulsar nearness, calculate the minimum spanning tree of the population, and discuss possible applications. The pulsar tree hosts information about pulsar similarities that go beyond $P$ and $\dot P$, and are thus naturally difficult to read from the $P\dot P$-diagram. We use this work to introduce the pulsar tree website http://www.pulsartree.ice.csic.es containing visualization tools and data to allow users to gather information in terms of MST and distance ranking.
AI Key Findings
Get AI-generated insights about this paper's methodology, results, and significance.
Paper Details
How to Cite This Paper
@article{patruno2022visualizing,
  title         = {Visualizing the pulsar population using graph theory},
  author        = {Patruno, Alessandro and García, C. R. and Torres, Diego F.},
  year          = {2022},
  eprint        = {2207.06311},
  archivePrefix = {arXiv},
  primaryClass  = {astro-ph.HE},
  doi           = {10.1093/mnras/stac1997},
}Patruno, A., García, C., & Torres, D. (2022). Visualizing the pulsar population using graph theory. arXiv. https://doi.org/10.1093/mnras/stac1997Patruno, Alessandro, et al. "Visualizing the pulsar population using graph theory." arXiv, 2022, doi.org/10.1093/mnras/stac1997.PDF Preview
Key Terms
Citation Network
Current paper (gray), citations (green), references (blue)
Display is limited for performance on very large graphs.
Similar Papers
Found 4 papers| Title | Authors | Year | Actions |
|---|
Comments (0)