Publication
Metrics
AI Quick Summary
This paper introduces SOMNUS, a visualization tool designed to help data workers understand complex data transformation scripts by providing intuitive, interactive glyphs and a provenance graph. User feedback indicates improved accuracy and preference over textual descriptions.
Paper Preview
Abstract
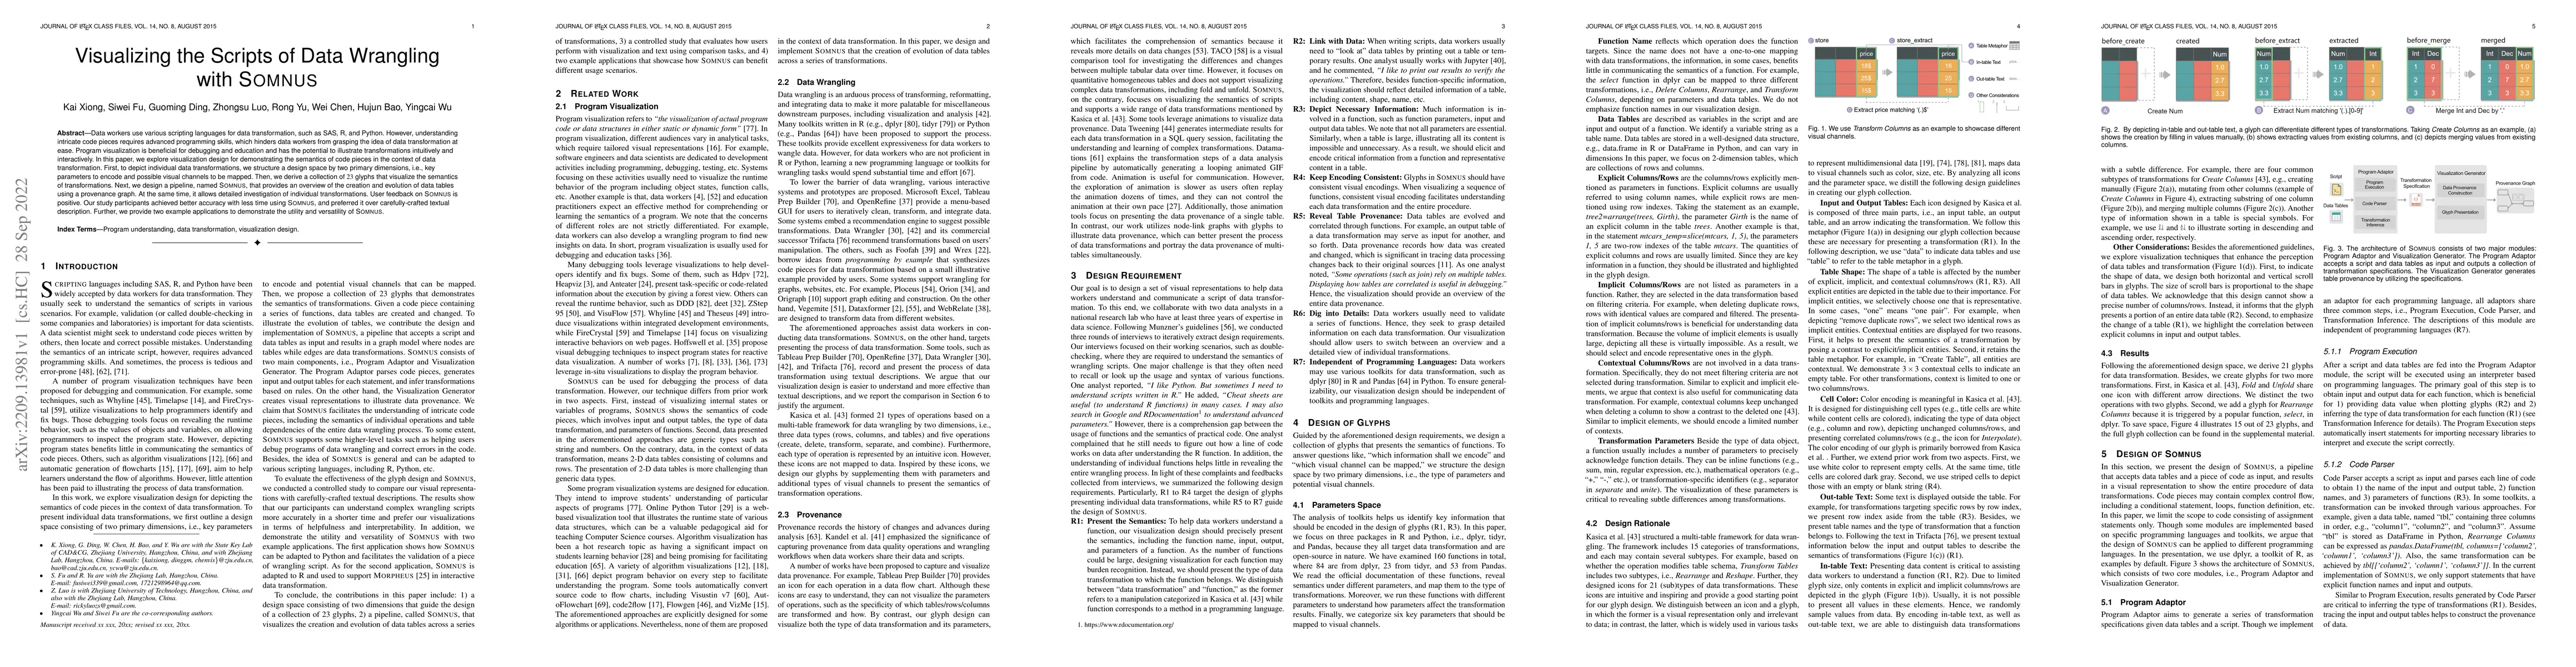
Data workers use various scripting languages for data transformation, such as SAS, R, and Python. However, understanding intricate code pieces requires advanced programming skills, which hinders data workers from grasping the idea of data transformation at ease. Program visualization is beneficial for debugging and education and has the potential to illustrate transformations intuitively and interactively. In this paper, we explore visualization design for demonstrating the semantics of code pieces in the context of data transformation. First, to depict individual data transformations, we structure a design space by two primary dimensions, i.e., key parameters to encode and possible visual channels to be mapped. Then, we derive a collection of 23 glyphs that visualize the semantics of transformations. Next, we design a pipeline, named Somnus, that provides an overview of the creation and evolution of data tables using a provenance graph. At the same time, it allows detailed investigation of individual transformations. User feedback on Somnus is positive. Our study participants achieved better accuracy with less time using Somnus, and preferred it over carefully-crafted textual description. Further, we provide two example applications to demonstrate the utility and versatility of Somnus.
AI Key Findings
Get AI-generated insights about this paper's methodology, results, significance, and more — seven facets brought into focus.
Impact
Paper Details
Authors
PDF Preview
Key Terms
Citation Network
Current paper (gray), citations (green), references (blue)
Display is limited for performance on very large graphs.
Discussion 0