Visualizing the Structure of Large Trees
Publication
Metrics
AI Quick Summary
This paper presents a novel two-dimensional visualization method for large tree structures, specifically applied to brain artery systems of 105 subjects, to detect and correct discrepancies. The method improved data accuracy, leading to modifications in 10% and deletions in 6.7% of the trees, and enhanced statistical significance in aging effects studies.
Paper Preview
Abstract
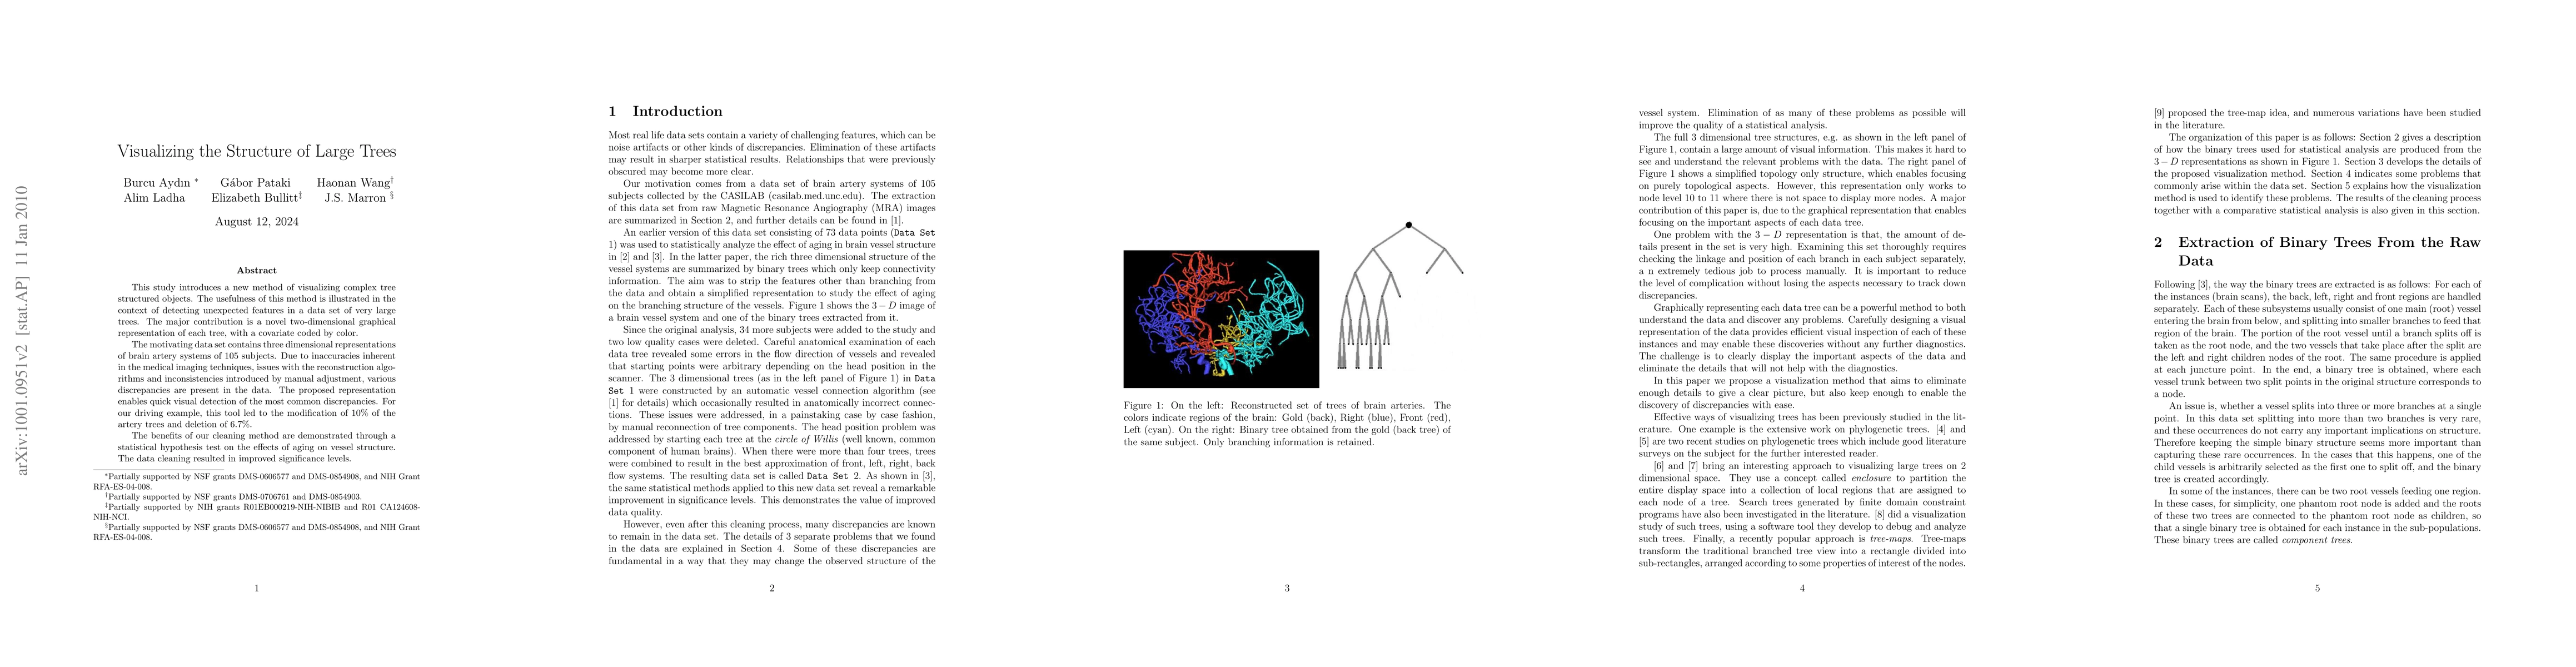
This study introduces a new method of visualizing complex tree structured objects. The usefulness of this method is illustrated in the context of detecting unexpected features in a data set of very large trees. The major contribution is a novel two-dimensional graphical representation of each tree, with a covariate coded by color. The motivating data set contains three dimensional representations of brain artery systems of 105 subjects. Due to inaccuracies inherent in the medical imaging techniques, issues with the reconstruction algo- rithms and inconsistencies introduced by manual adjustment, various discrepancies are present in the data. The proposed representation enables quick visual detection of the most common discrepancies. For our driving example, this tool led to the modification of 10% of the artery trees and deletion of 6.7%. The benefits of our cleaning method are demonstrated through a statistical hypothesis test on the effects of aging on vessel structure. The data cleaning resulted in improved significance levels.
AI Key Findings
Get AI-generated insights about this paper's methodology, results, significance, and more — seven facets brought into focus.
Impact
Paper Details
PDF Preview
Key Terms
Citation Network
Current paper (gray), citations (green), references (blue)
Display is limited for performance on very large graphs.
Discussion 0