01
MethodologyHow they did it
The research used a combination of spatial analysis and spectral methods to analyze point patterns
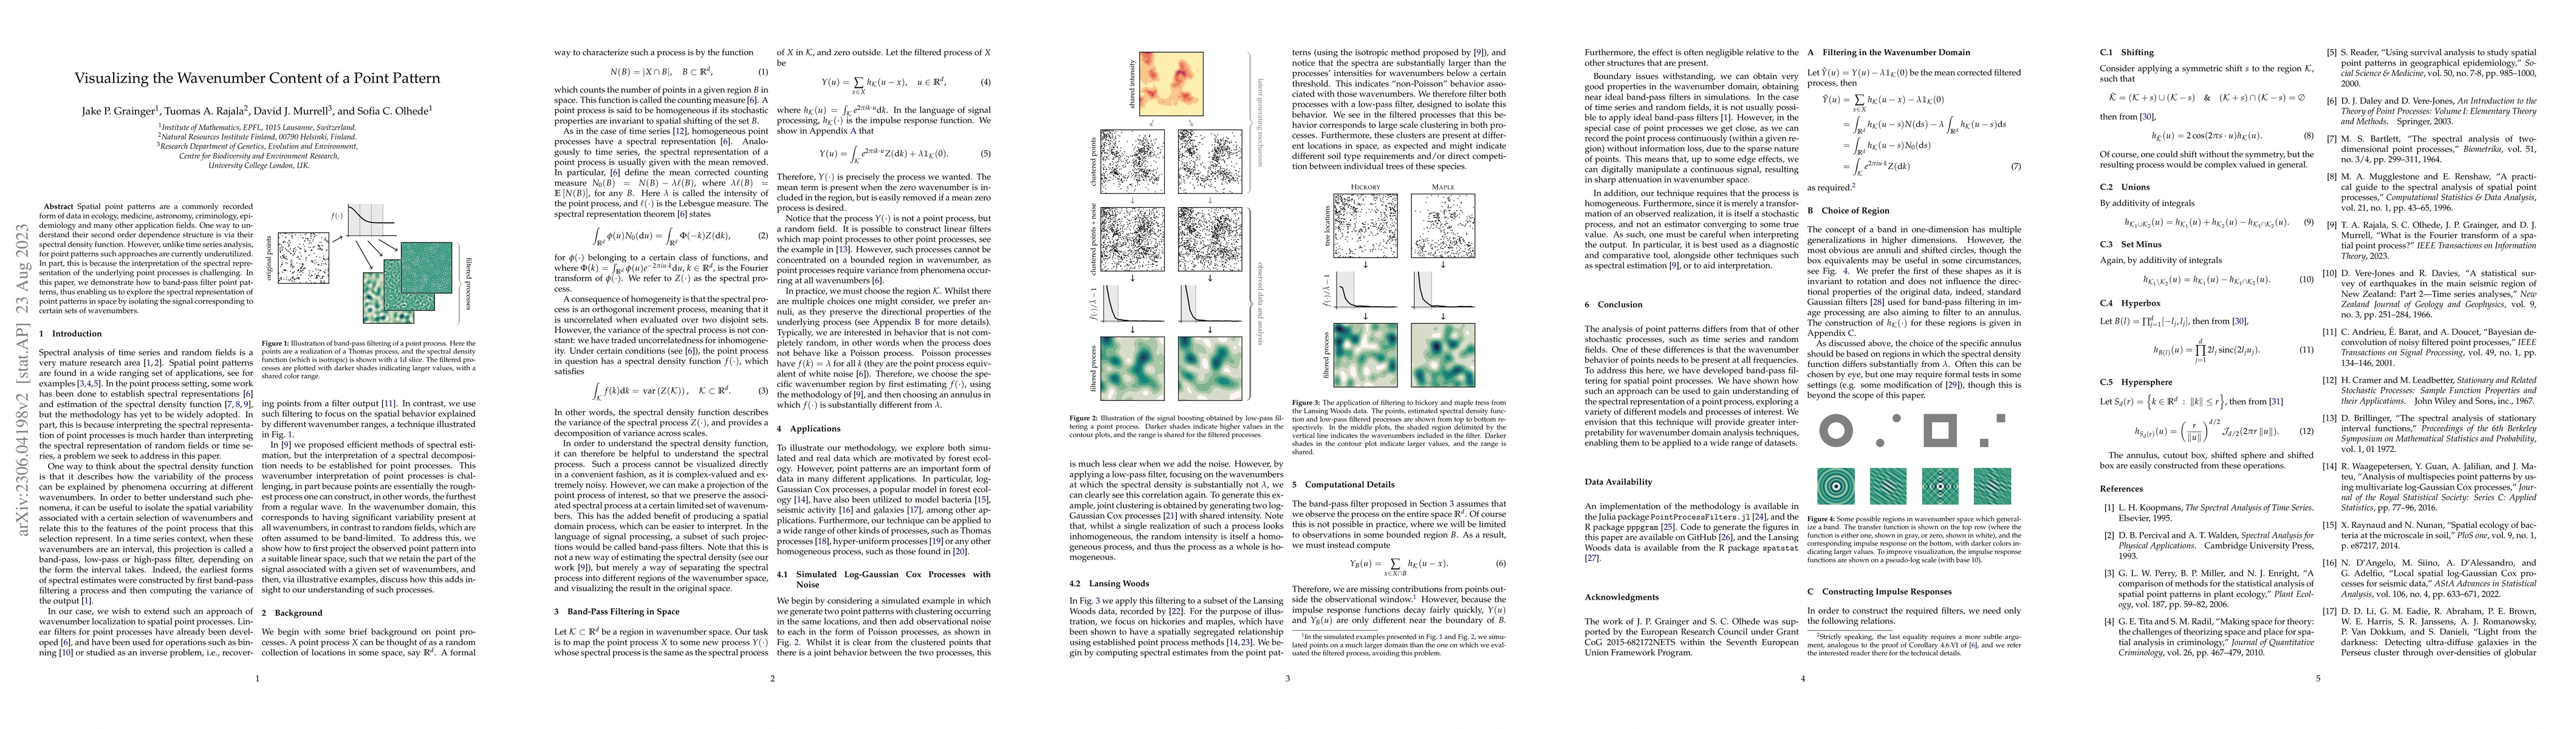
This paper introduces a method to band-pass filter spatial point patterns to visualize their spectral density function, facilitating the exploration of their second-order dependence structure and isolating signals corresponding to specific wavenumbers. This approach aims to enhance the analysis of point patterns in various fields like ecology and epidemiology.
This paper introduces a method to band-pass filter spatial point patterns to visualize their spectral density function, facilitating the exploration of their second-order dependence structure and isolating signals corresponding to specific wavenumbers. This approach aims to enhance the analysis of point patterns in various fields like ecology and epidemiology.
The research used a combination of spatial analysis and spectral methods to analyze point patterns More in Methodology →
Main finding 1: Spatial autocorrelation was significant at small scales — Main finding 2: The spectral analysis revealed a clear peak in the power spectrum More in Key Results →
This research is important because it provides new insights into the spatial patterns of point data, which has implications for various fields such as ecology and epidemiology More in Significance →
Limitation 1: The analysis was limited to two dimensions — Limitation 2: The sample size was relatively small More in Limitations →
Spatial point patterns are a commonly recorded form of data in ecology, medicine, astronomy, criminology, epidemiology and many other application fields. One way to understand their second order dependence structure is via their spectral density function. However, unlike time series analysis, for point patterns such approaches are currently underutilized. In part, this is because the interpretation of the spectral representation of the underlying point processes is challenging. In this paper, we demonstrate how to band-pass filter point patterns, thus enabling us to explore the spectral representation of point patterns in space by isolating the signal corresponding to certain sets of wavenumbers.
Seven facets of this paper, analysed and brought into focus by AI.
This research is important because it provides new insights into the spatial patterns of point data, which has implications for various fields such as ecology and epidemiology
The research used a combination of spatial analysis and spectral methods to analyze point patterns
This research is important because it provides new insights into the spatial patterns of point data, which has implications for various fields such as ecology and epidemiology
The research introduced a new method for analyzing the spectral properties of point patterns, which has potential applications in various fields
This work is novel because it combines multiple methods to analyze point patterns and provides new insights into their spatial structure
Current paper (gray), citations (green), references (blue)
Display is limited for performance on very large graphs.
Discussion 0