Visually Analyze SHAP Plots to Diagnose Misclassifications in ML-based Intrusion Detection
Publication
Metrics
AI Quick Summary
This paper proposes an explainable AI method using SHAP plots for visually diagnosing misclassifications in machine learning-based intrusion detection systems, aiming to simplify analyst decision-making by highlighting false positives and false negatives. The efficacy of the approach is demonstrated through case studies using multiple network traffic datasets.
Paper Preview
Abstract
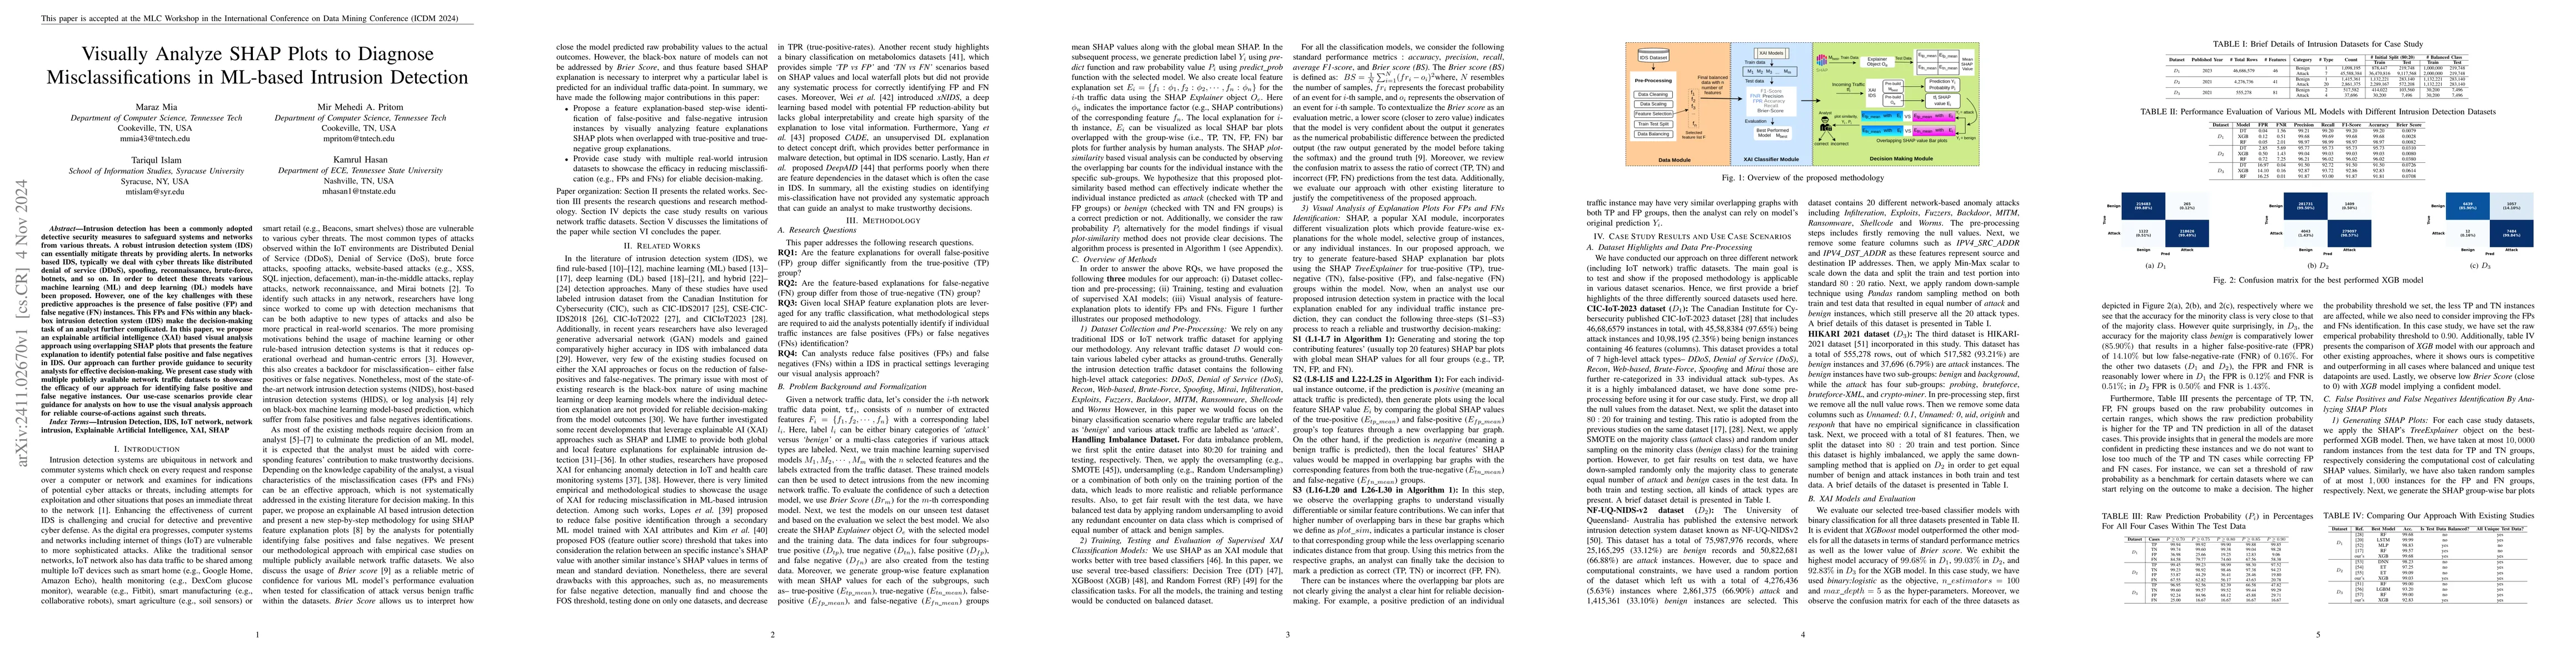
Intrusion detection has been a commonly adopted detective security measures to safeguard systems and networks from various threats. A robust intrusion detection system (IDS) can essentially mitigate threats by providing alerts. In networks based IDS, typically we deal with cyber threats like distributed denial of service (DDoS), spoofing, reconnaissance, brute-force, botnets, and so on. In order to detect these threats various machine learning (ML) and deep learning (DL) models have been proposed. However, one of the key challenges with these predictive approaches is the presence of false positive (FP) and false negative (FN) instances. This FPs and FNs within any black-box intrusion detection system (IDS) make the decision-making task of an analyst further complicated. In this paper, we propose an explainable artificial intelligence (XAI) based visual analysis approach using overlapping SHAP plots that presents the feature explanation to identify potential false positive and false negatives in IDS. Our approach can further provide guidance to security analysts for effective decision-making. We present case study with multiple publicly available network traffic datasets to showcase the efficacy of our approach for identifying false positive and false negative instances. Our use-case scenarios provide clear guidance for analysts on how to use the visual analysis approach for reliable course-of-actions against such threats.
AI Key Findings
Get AI-generated insights about this paper's methodology, results, significance, and more — seven facets brought into focus.
Impact
Paper Details
Authors
PDF Preview
Citation Network
Current paper (gray), citations (green), references (blue)
Display is limited for performance on very large graphs.
Discussion 0