Visually Analyzing Company-wide Software Service Dependencies: An Industrial Case Study
Publication
Metrics
AI Quick Summary
This paper presents a force-directed visualization tool developed by SAP to manage and understand complex software service dependencies, aiding in service retirement and deployment. The tool was iteratively refined based on user feedback, ultimately supporting data-driven decision making across the company.
Paper Preview
Abstract
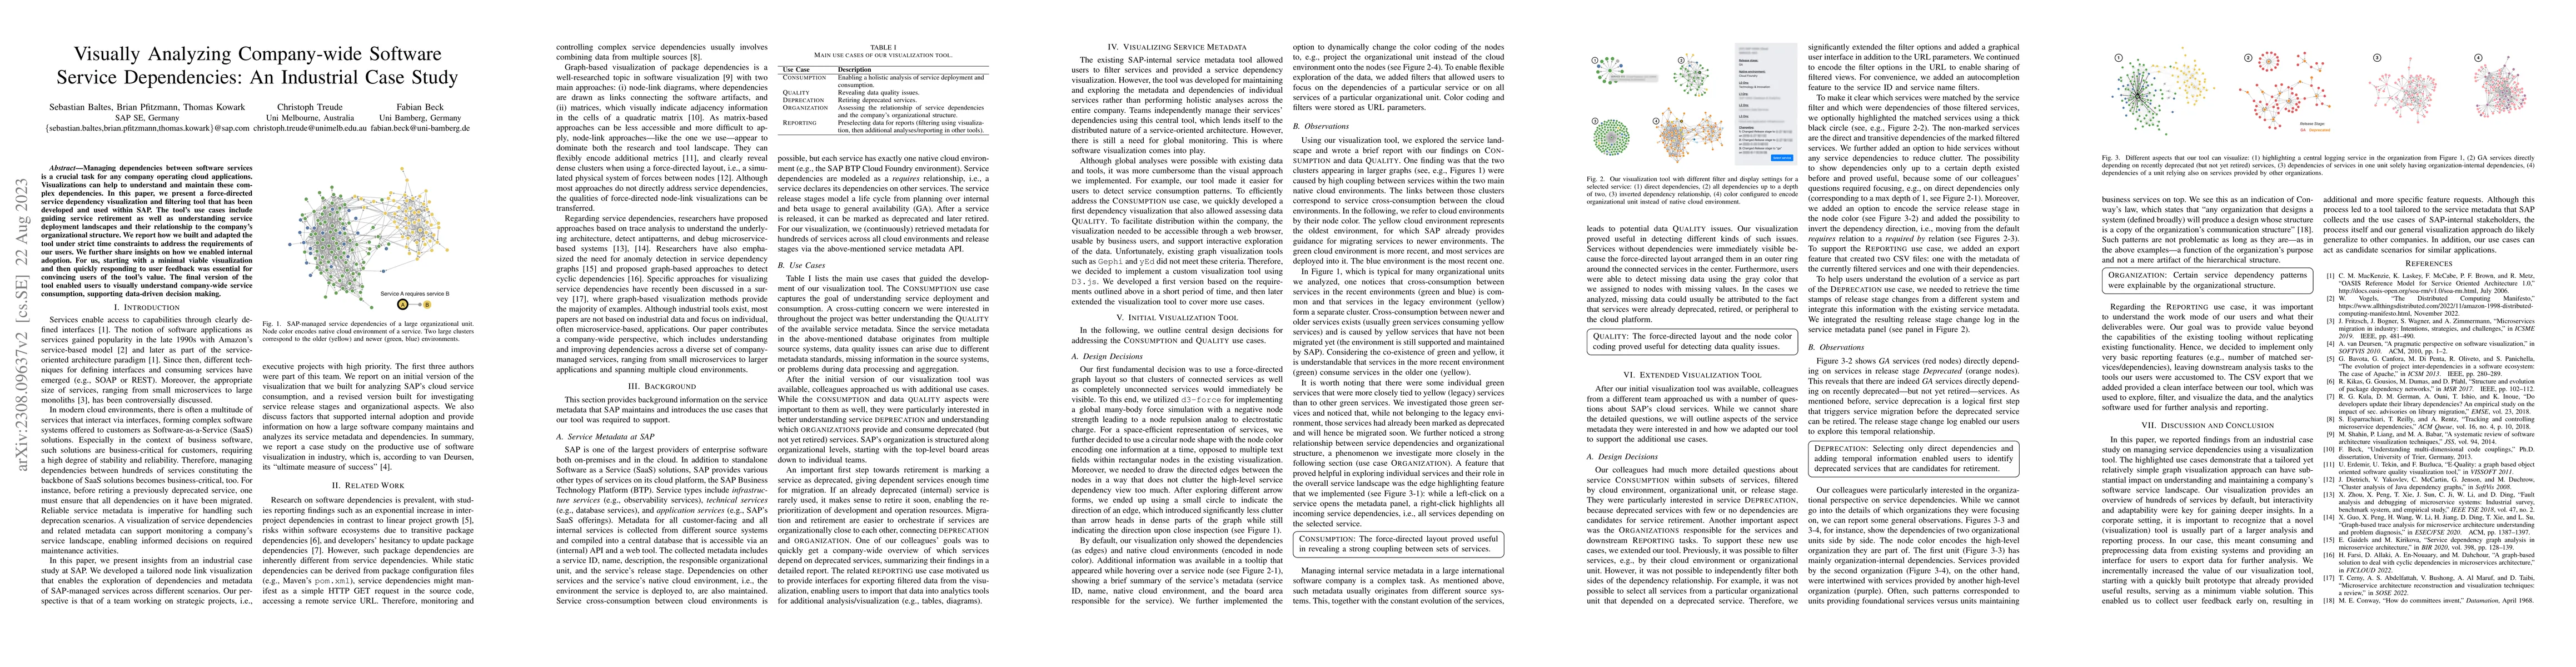
Managing dependencies between software services is a crucial task for any company operating cloud applications. Visualizations can help to understand and maintain these complex dependencies. In this paper, we present a force-directed service dependency visualization and filtering tool that has been developed and used within SAP. The tool's use cases include guiding service retirement as well as understanding service deployment landscapes and their relationship to the company's organizational structure. We report how we built and adapted the tool under strict time constraints to address the requirements of our users. We further share insights on how we enabled internal adoption. For us, starting with a minimal viable visualization and then quickly responding to user feedback was essential for convincing users of the tool's value. The final version of the tool enabled users to visually understand company-wide service consumption, supporting data-driven decision making.
AI Key Findings
Get AI-generated insights about this paper's methodology, results, significance, and more — seven facets brought into focus.
Impact
Paper Details
Authors
PDF Preview
Key Terms
Citation Network
Current paper (gray), citations (green), references (blue)
Display is limited for performance on very large graphs.
Discussion 0