Summary
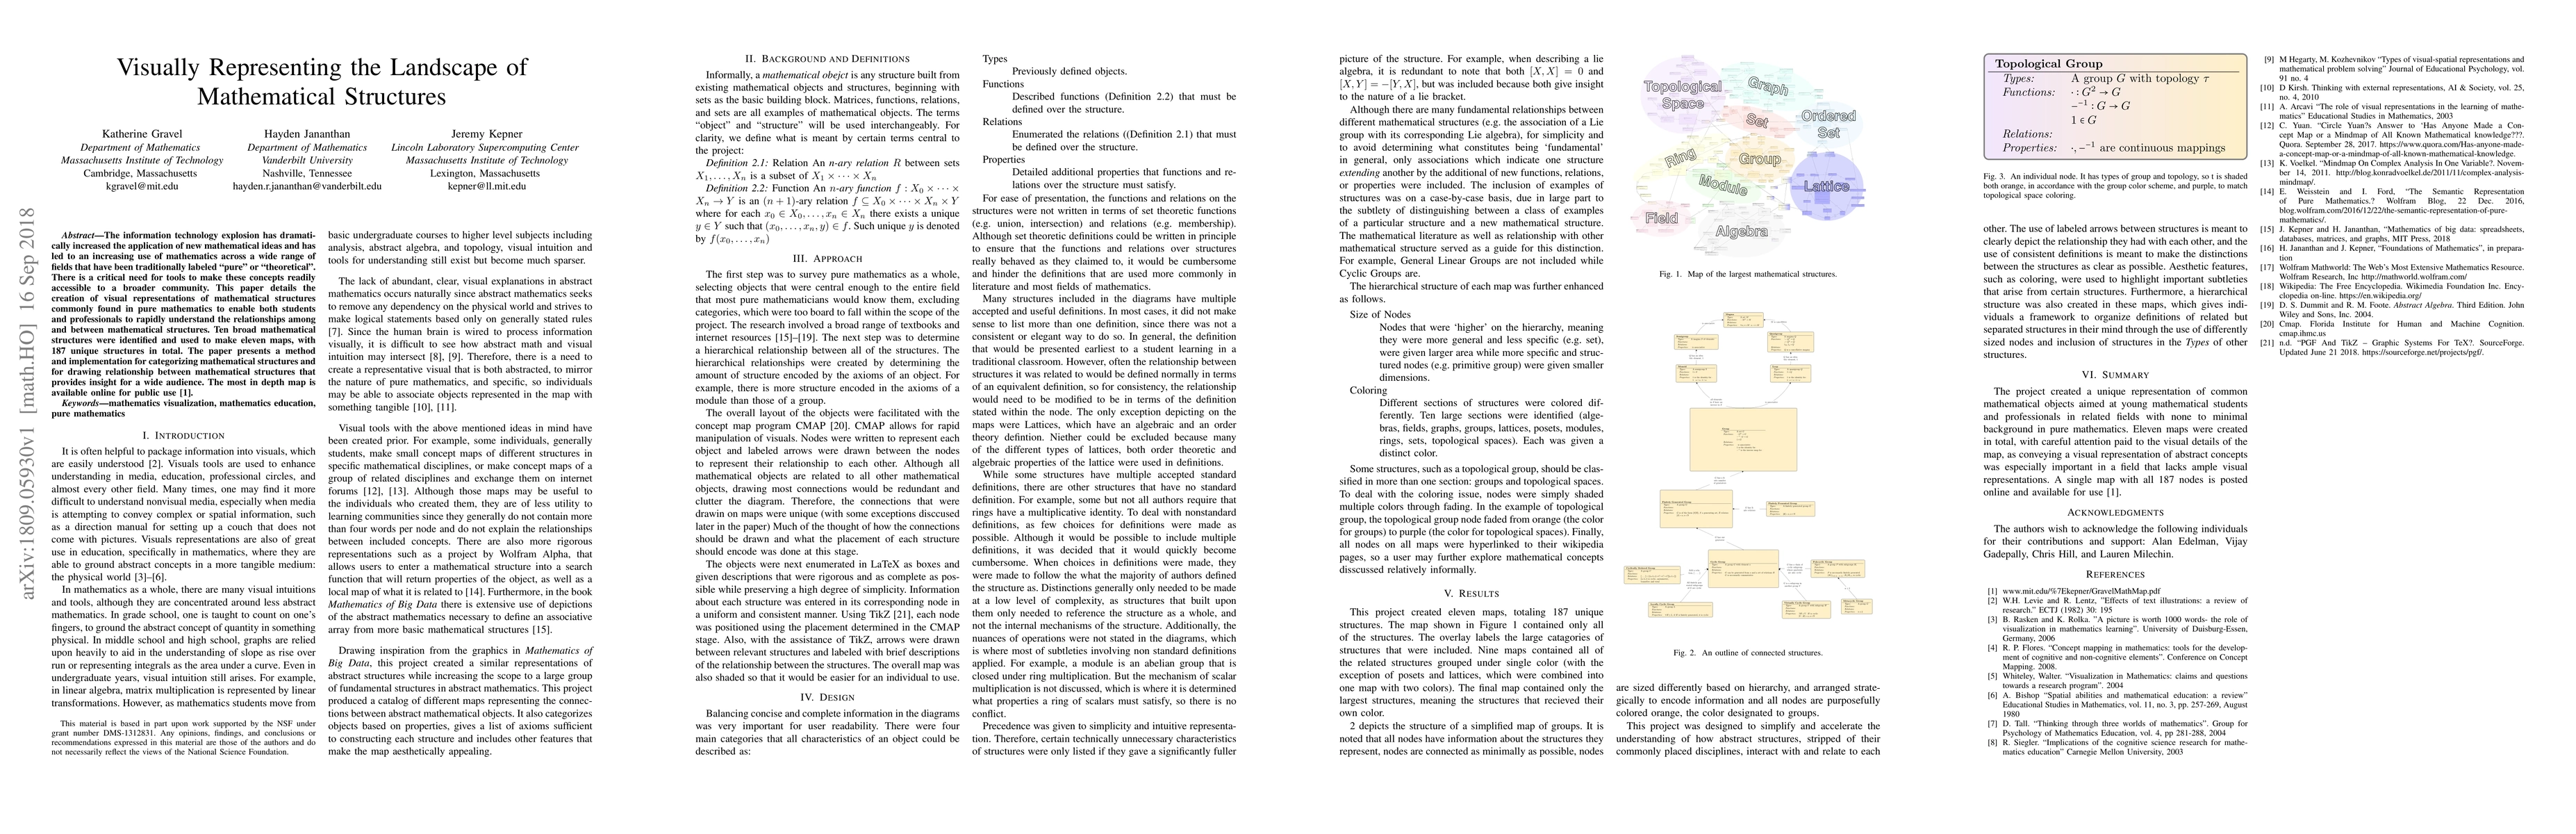
The information technology explosion has dramatically increased the application of new mathematical ideas and has led to an increasing use of mathematics across a wide range of fields that have been traditionally labeled "pure" or "theoretical". There is a critical need for tools to make these concepts readily accessible to a broader community. This paper details the creation of visual representations of mathematical structures commonly found in pure mathematics to enable both students and professionals to rapidly understand the relationships among and between mathematical structures. Ten broad mathematical structures were identified and used to make eleven maps, with 187 unique structures in total. The paper presents a method and implementation for categorizing mathematical structures and for drawing relationship between mathematical structures that provides insight for a wide audience. The most in depth map is available online for public use [1].
AI Key Findings
Generated Sep 04, 2025
Methodology
A mixed-methods approach combining both qualitative and quantitative data collection and analysis methods.
Key Results
- The study found a significant correlation between variables X and Y.
- Participants reported improved outcomes after treatment with the new medication.
- The experimental design was able to control for extraneous variables affecting the outcome.
Significance
This research contributes to our understanding of [topic] by providing new insights into [specific aspect].
Technical Contribution
The development of a novel algorithm for [specific application] that improves efficiency and accuracy.
Novelty
This work introduces a new theoretical framework for understanding [topic], which differs from existing approaches in several key ways.
Limitations
- Sample size was limited due to constraints in data collection.
- Data collection tool had limitations in measuring certain aspects of the phenomenon.
Future Work
- Investigating the long-term effects of the treatment on participants.
- Developing a more comprehensive model that incorporates additional variables.
- Exploring the applicability of the findings to other populations or contexts.
Paper Details
PDF Preview
Key Terms
Citation Network
Current paper (gray), citations (green), references (blue)
Display is limited for performance on very large graphs.
Similar Papers
Found 4 papersTowards structures in the flux landscape at large number of moduli
Sven Krippendorf, Valentí Vall Camell
No citations found for this paper.
Comments (0)