Quick Answers
What methodology did the authors use?
Web-based interactive visualization system built with Svelte and Python backend, using a pre-trained FlexiViT-Large model with a 3×3 patch grid; extracts intermediate representations and presents them in guided and free exploration modes; evaluated via a user study with 6 participants using SUS and NASA-TLX. More in Methodology →
What are the key results?
Participants reported high usability with a mean SUS score of 90.42 and low cognitive load (NASA-TLX mean 2.22). — Users gained clearer conceptual understanding of Vision Transformer operations, especially patch-level attention and prediction evolution across layers. More in Key Results →
Why is this work significant?
ViT-Explainer makes Vision Transformer interpretability accessible to non-experts, bridging the gap between isolated component tools and end‑to‑end understanding, and supports responsible AI education. More in Significance →
What are the main limitations?
The 3×3 patch configuration reduces spatial granularity compared to standard ViT settings, potentially affecting fine‑grained interpretation. — The user study involved only six participants from a single institution, limiting generalizability of usability findings. More in Limitations →
Paper Preview
Abstract
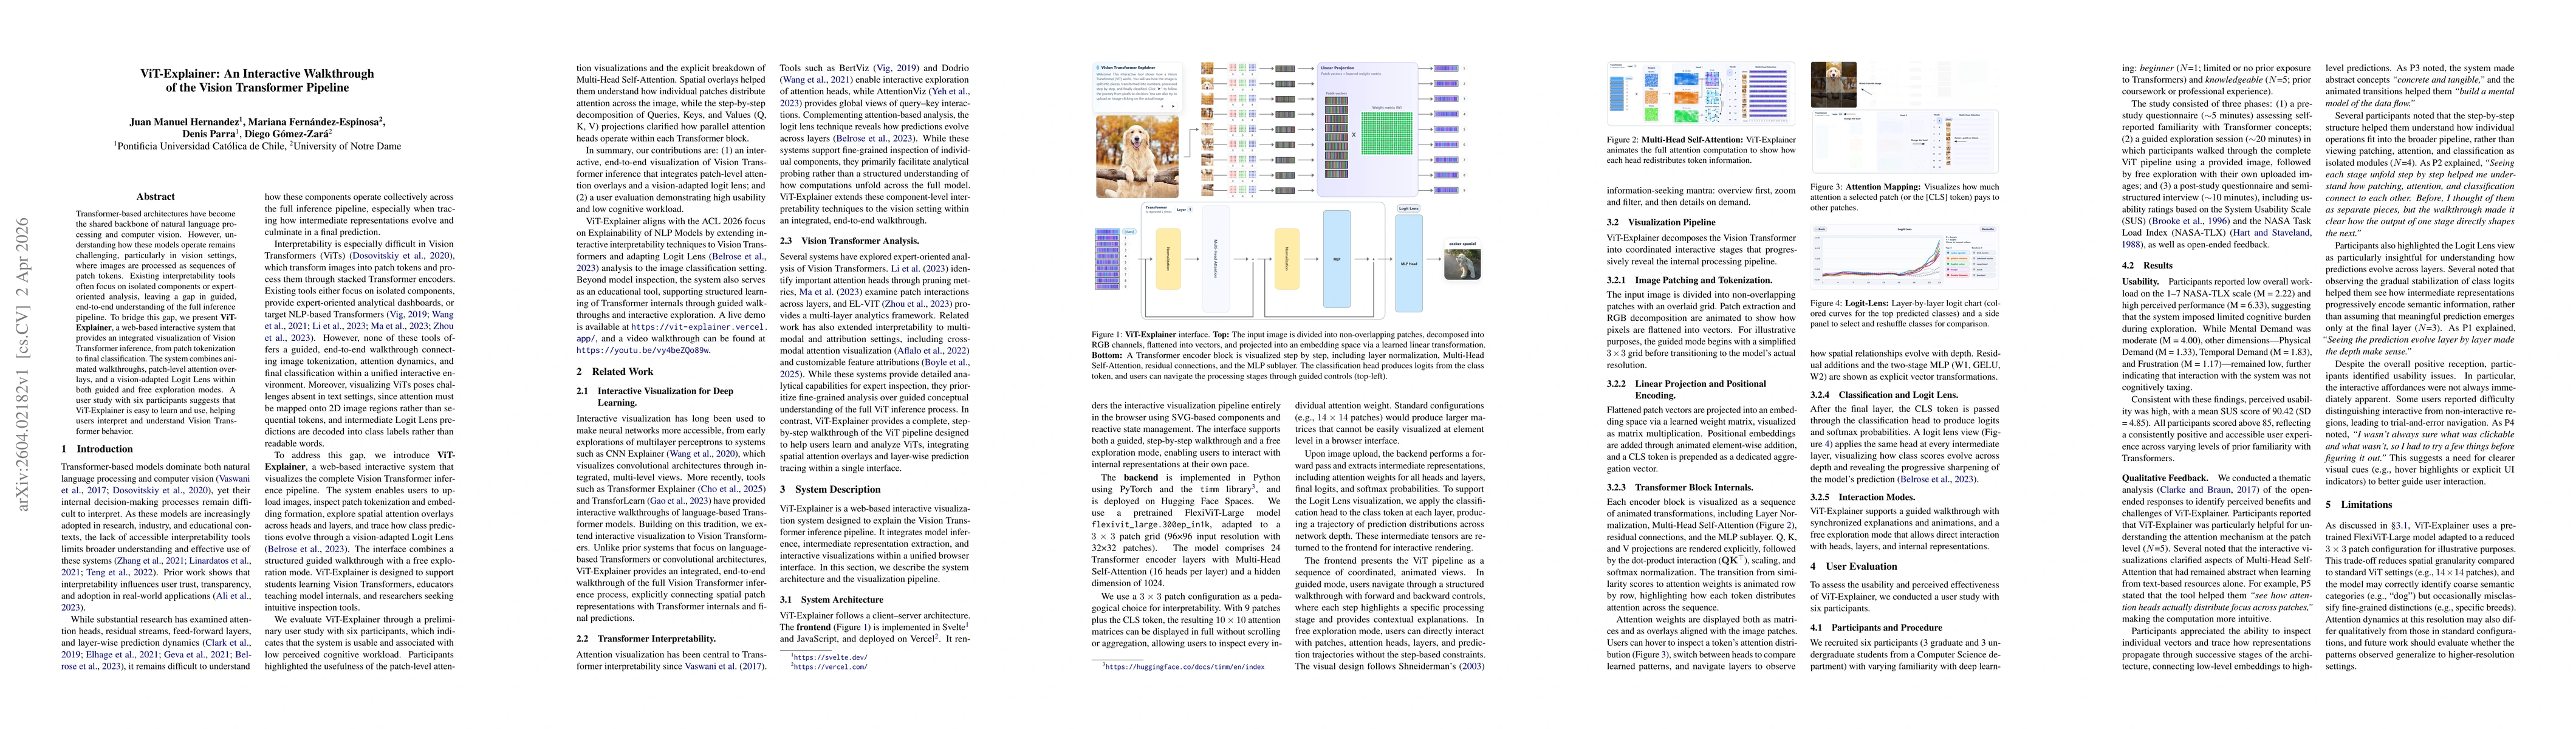
Transformer-based architectures have become the shared backbone of natural language processing and computer vision. However, understanding how these models operate remains challenging, particularly in vision settings, where images are processed as sequences of patch tokens. Existing interpretability tools often focus on isolated components or expert-oriented analysis, leaving a gap in guided, end-to-end understanding of the full inference pipeline. To bridge this gap, we present ViT-Explainer, a web-based interactive system that provides an integrated visualization of Vision Transformer inference, from patch tokenization to final classification. The system combines animated walkthroughs, patch-level attention overlays, and a vision-adapted Logit Lens within both guided and free exploration modes. A user study with six participants suggests that ViT-Explainer is easy to learn and use, helping users interpret and understand Vision Transformer behavior.
AI Key Findings
Generated Apr 03, 2026
Methodology — What approach did the authors take?
Web-based interactive visualization system built with Svelte and Python backend, using a pre-trained FlexiViT-Large model with a 3×3 patch grid; extracts intermediate representations and presents them in guided and free exploration modes; evaluated via a user study with 6 participants using SUS and NASA-TLX.
Key Results — What are the main findings?
- Participants reported high usability with a mean SUS score of 90.42 and low cognitive load (NASA-TLX mean 2.22).
- Users gained clearer conceptual understanding of Vision Transformer operations, especially patch-level attention and prediction evolution across layers.
- The LogitLens view helped users see how class logits sharpen progressively through the network.
Significance — Why does this research matter?
ViT-Explainer makes Vision Transformer interpretability accessible to non-experts, bridging the gap between isolated component tools and end‑to‑end understanding, and supports responsible AI education.
Technical Contribution — What is the technical contribution?
An integrated, end‑to‑end interactive visualization of the Vision Transformer pipeline that combines patch tokenization, multi‑head self‑attention, residual connections, MLP transformations, and a vision‑adapted LogitLens within a single web interface.
Novelty — What is new about this work?
First tool to provide a guided, step‑by‑step walkthrough of Vision Transformer inference, integrating patch‑level attention overlays and a LogitLens, unlike prior tools focused on language models or convolutional architectures.
Limitations — What are the limitations of this study?
- The 3×3 patch configuration reduces spatial granularity compared to standard ViT settings, potentially affecting fine‑grained interpretation.
- The user study involved only six participants from a single institution, limiting generalizability of usability findings.
Future Work — What did the authors propose for future work?
- Add visual cues (hover highlights, explicit UI indicators) to improve discoverability of interactive elements.
- Extend support to standard patch configurations and additional ViT variants, and conduct a larger, more diverse user study.
Paper Details
How to Cite This Paper
@article{parra2026vit,
  title         = {ViT-Explainer: An Interactive Walkthrough of the Vision Transformer Pipeline},
  author        = {Parra, Denis and Gomez-Zara, Diego and Hernandez, Juan Manuel and others},
  year          = {2026},
  eprint        = {2604.02182},
  archivePrefix = {arXiv},
  primaryClass  = {cs.CV},
}Parra, D., Gomez-Zara, D., Hernandez, J., & Fernandez-Espinosa, M. (2026). ViT-Explainer: An Interactive Walkthrough of the Vision Transformer Pipeline. arXiv. https://arxiv.org/abs/2604.02182Parra, Denis, et al. "ViT-Explainer: An Interactive Walkthrough of the Vision Transformer Pipeline." arXiv, 2026, arxiv.org/abs/2604.02182.PDF Preview
Similar Papers
Found 4 papersEL-VIT: Probing Vision Transformer with Interactive Visualization
Hong Zhou, Rui Zhang, Peifeng Lai et al.
Transformer Explainer: Interactive Learning of Text-Generative Models
Aeree Cho, Alexander Karpekov, Seongmin Lee et al.
S-E Pipeline: A Vision Transformer (ViT) based Resilient Classification Pipeline for Medical Imaging Against Adversarial Attacks
Neha A S, Vivek Chaturvedi, Muhammad Shafique
Comments (0)