viz2viz: Prompt-driven stylized visualization generation using a diffusion model
Publication
Metrics
AI Quick Summary
viz2viz is a system that transforms traditional visualizations into stylized idioms using textual prompts and a diffusion model, enabling diverse mark transformations and scene synthesis while maintaining dataset properties. The method is adaptable to various visualization types and emphasizes coherence across different marks.
Paper Preview
Abstract
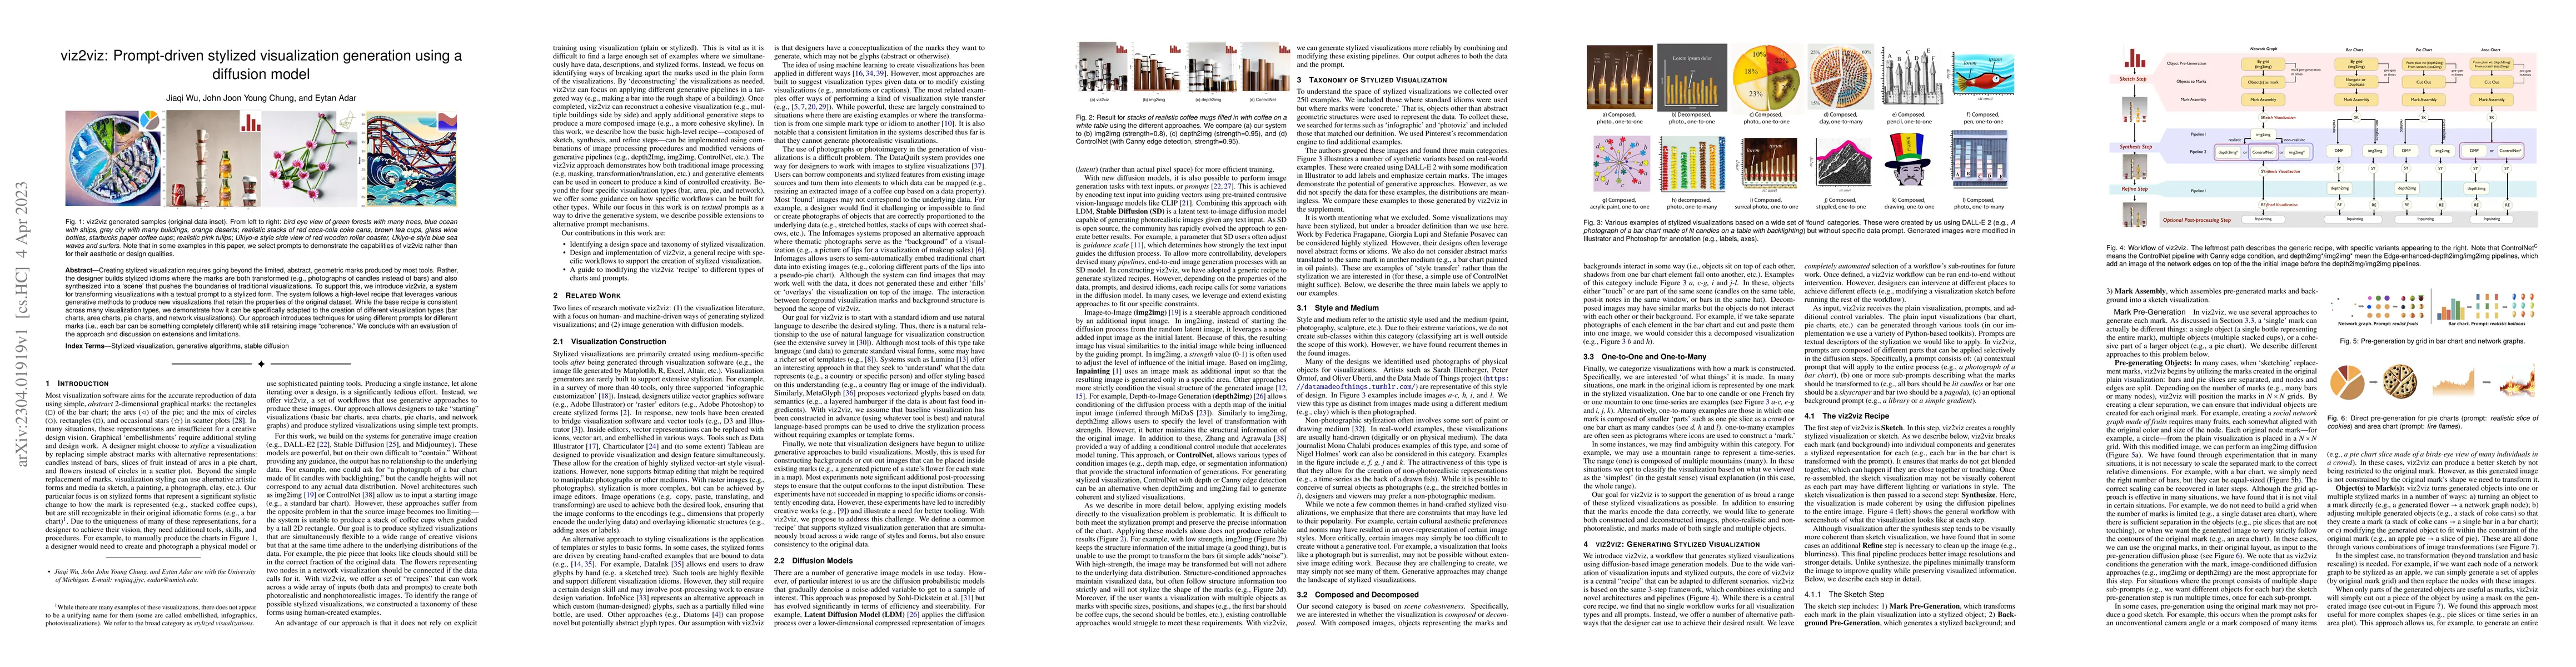
Creating stylized visualization requires going beyond the limited, abstract, geometric marks produced by most tools. Rather, the designer builds stylized idioms where the marks are both transformed (e.g., photographs of candles instead of bars) and also synthesized into a 'scene' that pushes the boundaries of traditional visualizations. To support this, we introduce viz2viz, a system for transforming visualizations with a textual prompt to a stylized form. The system follows a high-level recipe that leverages various generative methods to produce new visualizations that retain the properties of the original dataset. While the base recipe is consistent across many visualization types, we demonstrate how it can be specifically adapted to the creation of different visualization types (bar charts, area charts, pie charts, and network visualizations). Our approach introduces techniques for using different prompts for different marks (i.e., each bar can be something completely different) while still retaining image "coherence." We conclude with an evaluation of the approach and discussion on extensions and limitations.
AI Key Findings
Get AI-generated insights about this paper's methodology, results, significance, and more — seven facets brought into focus.
Impact
Paper Details
Authors
PDF Preview
Key Terms
Citation Network
Current paper (gray), citations (green), references (blue)
Display is limited for performance on very large graphs.
Discussion 0