VizAbility introduces a novel system for enhancing chart accessibility through LLM-based conversational interaction, allowing visually impaired users to explore visual data trends using natural language queries. Evaluations show promising results in improving navigation accuracy and contextual information retrieval.
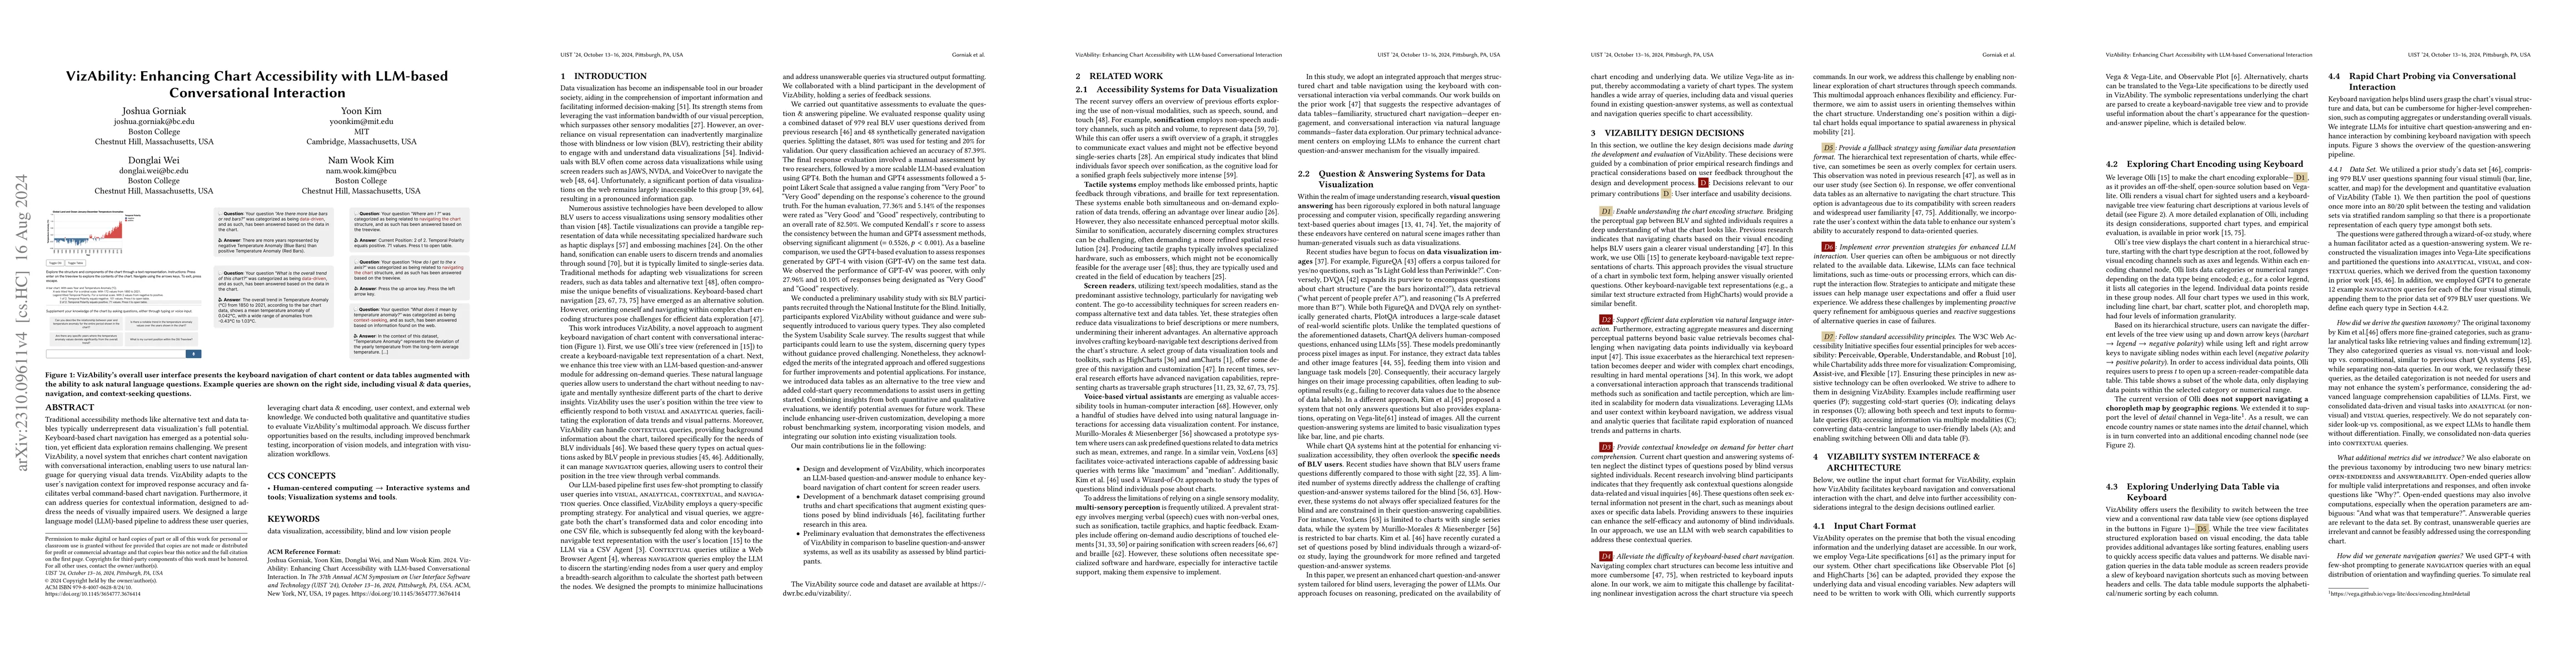
Traditional accessibility methods like alternative text and data tables typically underrepresent data visualization's full potential. Keyboard-based chart navigation has emerged as a potential solution, yet efficient data exploration remains challenging. We present VizAbility, a novel system that enriches chart content navigation with conversational interaction, enabling users to use natural language for querying visual data trends. VizAbility adapts to the user's navigation context for improved response accuracy and facilitates verbal command-based chart navigation. Furthermore, it can address queries for contextual information, designed to address the needs of visually impaired users. We designed a large language model (LLM)-based pipeline to address these user queries, leveraging chart data & encoding, user context, and external web knowledge. We conducted both qualitative and quantitative studies to evaluate VizAbility's multimodal approach. We discuss further opportunities based on the results, including improved benchmark testing, incorporation of vision models, and integration with visualization workflows.
Get AI-generated insights about this paper's methodology, results, and significance.
Current paper (gray), citations (green), references (blue)
No similar papers found for this research.
Title | Authors | Year | Actions |
---|---|---|---|
Benchmarking Visual Language Models on Standardized Visualization Literacy Tests
|
Saugat Pandey, Alvitta Ottley
|
2025
|
View Paper |
A Review on Large Language Models for Visual Analytics
|
Navya Sonal Agarwal, S. K. Sonbhadra
|
2025
|
View Paper |
Title | Authors | Year | Actions |
---|---|---|---|
MAIDR: Making Statistical Visualizations Accessible with Multimodal Data Representation
|
JooYoung Seo, Yilin Xia, Bongshin Lee, Sean McCurry, Yu Jun Yam
|
2024
|
View Paper |
Azimuth: Designing Accessible Dashboards for Screen Reader Users
|
Arjun Srinivasan, Tim Harshbarger, Darrell Hilliker, Jennifer Mankoff
|
2023
|
View Paper |
Data Navigator: An Accessibility-Centered Data Navigation Toolkit
|
Frank Elavsky, Lucas Nadolskis, Dominik Moritz
|
2023
|
View Paper |
“Customization is Key”: Reconfigurable Textual Tokens for Accessible Data Visualizations
|
Shuli Jones, Isabella Pedraza Pineros, Daniel Hajas, Jonathan Zong, Arvind Satyanarayan
|
2023
|
View Paper |
"I wouldn’t say offensive but...": Disability-Centered Perspectives on Large Language Models
|
Vinitha Gadiraju, Shaun K. Kane, Sunipa Dev, Alex S Taylor, Ding Wang, Emily Denton, Robin N. Brewer
|
2023
|
View Paper |
Beyond Alternative Text and tables: Comparative Analysis of Visualization Tools and Accessibility Methods
|
Nam Wook Kim, Grace Ataguba, Shakila Cherise S. Joyner, Chuangdian Zhao, Hyejin Im
|
2023
|
View Paper |
In-Context Impersonation Reveals Large Language Models' Strengths and Biases
|
Leonard Salewski, Stephan Alaniz, Isabel Rio-Torto, Eric Schulz, Zeynep Akata
|
2023
|
View Paper |
Can Large Language Models Be an Alternative to Human Evaluations?
|
Cheng-Han Chiang, Hung-yi Lee
|
2023
|
View Paper |
Exploring Chart Question Answering for Blind and Low Vision Users
|
Jiho Kim, Arjun Srinivasan, N. Kim, Yea-Seul Kim
|
2023
|
View Paper |
Chart Reader: Accessible Visualization Experiences Designed with Screen Reader Users
|
John Thompson, Jesse J Martinez, Alper Sarıkaya, Edward Cutrell, Bongshin Lee
|
2023
|
View Paper |
G-Eval: NLG Evaluation using GPT-4 with Better Human Alignment
|
Yang Liu, Dan Iter, Yichong Xu, Shuo Wang, Ruochen Xu, Chenguang Zhu
|
2023
|
View Paper |
Is ChatGPT a Good NLG Evaluator? A Preliminary Study
|
Jiaan Wang, Yunlong Liang, Fandong Meng, Zengkui Sun, Haoxiang Shi, Zhixu Li, Jinan Xu, Jianfeng Qu, Jie Zhou
|
2023
|
View Paper |
SeeChart: Enabling Accessible Visualizations Through Interactive Natural Language Interface For People with Visual Impairments
|
Md. Zubair Ibne Alam, Shehnaz Islam, Enamul Hoque
|
2023
|
View Paper |
OpenCQA: Open-ended Question Answering with Charts
|
Shankar Kantharaj, Do Xuan Long, Rixie Tiffany Ko Leong, J. Tan, Enamul Hoque, Shafiq R. Joty
|
2022
|
View Paper |
Seeing Through Sounds: Mapping Auditory Dimensions to Data and Charts for People with Visual Impairments
|
R. Wang, C. Jung, Y. Kim
|
2022
|
View Paper |
Rich Screen Reader Experiences for Accessible Data Visualization
|
Jonathan Zong, Crystal Lee, Alan Lundgard, JiWoong Jang, Daniel Hajas, Arvind Satyanarayan
|
2022
|
View Paper |
Chart Question Answering: State of the Art and Future Directions
|
Enamul Hoque, P. Kavehzadeh, Ahmed Masry
|
2022
|
View Paper |
VoxLens: Making Online Data Visualizations Accessible with an Interactive JavaScript Plug-In
|
Ather Sharif, Olivia H. Wang, Alida T. Muongchan, Katharina Reinecke, J. Wobbrock, Jacob O. obbrock
|
2022
|
View Paper |
Visualization Accessibility in the Wild: Challenges Faced by Visualization Designers
|
Shakila Cherise S. Joyner, A. Riegelhuth, Kathleen Garrity, Yea-Seul Kim, N. Kim
|
2022
|
View Paper |
ChartQA: A Benchmark for Question Answering about Charts with Visual and Logical Reasoning
|
Ahmed Masry, Do Xuan Long, J. Tan, Shafiq R. Joty, Enamul Hoque
|
2022
|
View Paper |
Accessible Visualization via Natural Language Descriptions: A Four-Level Model of Semantic Content
|
Alan Lundgard, Arvind Satyanarayan
|
2021
|
View Paper |
Towards Understanding Sensory Substitution for Accessible Visualization: An Interview Study
|
Pramod Chundury, Biswaksen Patnaik, Yasmin Reyazuddin, Christine Tang, J. Lazar, N. Elmqvist
|
2021
|
View Paper |
Communicating Visualizations without Visuals: Investigation of Visualization Alternative Text for People with Visual Impairments
|
C. Jung, Shubham Mehta, Atharva Kulkarni, Yuhang Zhao, Yea-Seul Kim
|
2021
|
View Paper |
Accessible Visualization: Design Space, Opportunities, and Challenges
|
N. Kim, Shakila Cherise S. Joyner, A. Riegelhuth, Yea-Seul Kim
|
2021
|
View Paper |
Inclusive data visualization for people with disabilities
|
K. Marriott, Bongshin Lee, M. Butler, Edward Cutrell, K. Ellis, Cagatay Goncu, Marti A. Hearst, Kathleen F. McCoy, D. Szafir
|
2021
|
View Paper |
COVID-19 highlights the issues facing blind and visually impaired people in accessing data on the web
|
A. Siu, Danyang Fan, Gene S.-H. Kim, Hrishikesh V. Rao, Xavier Vazquez, Sile O'Modhrain, Sean Follmer
|
2021
|
View Paper |
Unifying Vision-and-Language Tasks via Text Generation
|
Jaemin Cho, Jie Lei, Hao Tan, Mohit Bansal
|
2021
|
View Paper |
Image Captioning as an Assistive Technology: Lessons Learned from VizWiz 2020 Challenge
|
Pierre L. Dognin, Igor Melnyk, Youssef Mroueh, Inkit Padhi, Mattia Rigotti, Jarret Ross, Yair Schiff, R. Young, Brian M. Belgodere
|
2020
|
View Paper |
Answering Questions about Charts and Generating Visual Explanations
|
Dae Hyun Kim, Enamul Hoque, Maneesh Agrawala
|
2020
|
View Paper |
HybridQA: A Dataset of Multi-Hop Question Answering over Tabular and Textual Data
|
Wenhu Chen, Hanwen Zha, Zhiyu Chen, Wenhan Xiong, Hong Wang, W. Wang
|
2020
|
View Paper |
Reaching Broader Audiences With Data Visualization
|
Bongshin Lee, E. Choe, Petra Isenberg, K. Marriott, J. Stasko, T. Rhyne
|
2020
|
View Paper |
VERSE: Bridging Screen Readers and Voice Assistants for Enhanced Eyes-Free Web Search
|
Alexandra Vtyurina, Adam Fourney, M. Morris, Leah Findlater, Ryen W. White
|
2019
|
View Paper |
Comparing User Performance on Parallel-Tone, Parallel-Speech, Serial-Tone and Serial-Speech Auditory Graphs
|
Prabodh Sakhardande, Anirudha N. Joshi, Charudatta Jadhav, Manjiri Joshi
|
2019
|
View Paper |
Sentence-BERT: Sentence Embeddings using Siamese BERT-Networks
|
Nils Reimers, Iryna Gurevych
|
2019
|
View Paper |
Vega-Lite: A Grammar of Interactive Graphics
|
Arvind Satyanarayan, Dominik Moritz, Kanit Wongsuphasawat, Jeffrey Heer
|
2018
|
View Paper |
Whisper
|
Martina Brachmann, O. Landsiedel, D. Göhringer, S. Santini
|
2018
|
View Paper |
A User Study to Evaluate Tactile Charts with Blind and Visually Impaired People
|
Christin Engel, G. Weber
|
2018
|
View Paper |
An Accessible Interaction Model for Data Visualisation in Statistics
|
A. Jonathan R. Godfrey, Paul Murrell, V. Sorge
|
2018
|
View Paper |
VizWiz Grand Challenge: Answering Visual Questions from Blind People
|
D. Gurari, Qing Li, Abigale Stangl, Anhong Guo, Chi Lin, K. Grauman, Jiebo Luo, Jeffrey P. Bigham
|
2018
|
View Paper |
DVQA: Understanding Data Visualizations via Question Answering
|
Kushal Kafle, Scott D. Cohen, Brian L. Price, Christopher Kanan
|
2018
|
View Paper |
FigureQA: An Annotated Figure Dataset for Visual Reasoning
|
Samira Ebrahimi Kahou, Adam Atkinson, Vincent Michalski, Ákos Kádár, Adam Trischler, Yoshua Bengio
|
2017
|
View Paper |
Improve the Accessibility of Tactile Charts
|
Christin Engel, G. Weber
|
2017
|
View Paper |
Learning Visual Importance for Graphic Designs and Data Visualizations
|
Z. Bylinskii, N. Kim, Peter O'Donovan, Sami Alsheikh, Spandan Madan, H. Pfister, F. Durand, Bryan C. Russell, Aaron Hertzmann
|
2017
|
View Paper |
Analysis of Tactile Chart Design
|
Christin Engel, G. Weber
|
2017
|
View Paper |
Visual question answering: Datasets, algorithms, and future challenges
|
Kushal Kafle, Christopher Kanan
|
2016
|
View Paper |
Visual question answering: A survey of methods and datasets
|
Qi Wu, Damien Teney, Peng Wang, Chunhua Shen, A. Dick, A. Hengel
|
2016
|
View Paper |
VQA: Visual Question Answering
|
Aishwarya Agrawal, Jiasen Lu, Stanislaw Antol, Margaret Mitchell, C. L. Zitnick, Devi Parikh, Dhruv Batra
|
2015
|
View Paper |
AudioFunctions: Eyes-Free Exploration of Mathematical Functions on Tablets
|
Marzia Taibbi, C. Bernareggi, Andrea Gerino, D. Ahmetovic, S. Mascetti
|
2014
|
View Paper |
Evaluating a Tool for Improving Accessibility to Charts and Graphs
|
L. Ferres, G. Lindgaard, Livia Sumegi, Bruce Tsuji
|
2013
|
View Paper |
GraVVITAS: Generic Multi-touch Presentation of Accessible Graphics
|
Cagatay Goncu, K. Marriott
|
2011
|
View Paper |
Review of Designs for Haptic Data Visualization
|
Sabrina A. Panëels, Jonathan C. Roberts
|
2010
|
View Paper |
The Value of Information Visualization
|
Jean-Daniel Fekete, J. V. Wijk, J. Stasko, Chris North
|
2008
|
View Paper |
Low-level components of analytic activity in information visualization
|
R. Amar, James R. Eagan, J. Stasko
|
2005
|
View Paper |
Evaluation of Long Descriptions of Statistical Graphics for Blind and Low Vision Web Users
|
H. K. Ault, J. W. Deloge, R. W. Lapp, M. J. Morgan, J. R. Barnett
|
2002
|
View Paper |
Development of a Talking Tactile Tablet
|
Steven Landau, K. Gourgey
|
2001
|
View Paper |
Usability Analysis of Visual Programming Environments: A 'Cognitive Dimensions' Framework
|
T. Green, M. Petre
|
1996
|
View Paper |
National Federation of the Blind
|
R. Wilkin
|
1958
|
View Paper |
Leveraging Large Language Models for NLG Evaluation: A Survey
|
Zhen Li, Xiaohan Xu, Tao Shen, Can Xu, Jia-Chen Gu, Chongyang Tao
|
2024
|
View Paper |
Observable Plot
|
2024
|
||
. Screen Reader User Survey
|
2023
|
||
Non-Visually Performing Analytical Tasks on Statistical Charts
|
Tomás Murillo-Morales, Klaus Miesenberger
|
2017
|
View Paper |
ASVG-AccessibleScalableVectorGraphics:intentiontreestomake chartsmoreaccessibleandusable
|
2015
|
||
2023. Chart
|
|||
2022. Olli: An Extensible Visualization Library for Screen Reader Accessibility
|
|||
2023. WAI Accessibility Principles
|
|||
Association for Computing Machinery, New York, NY, USA, Article 83
|
|||
CSS color codes
|
|||
Conference acronym ’XX, June 03–05, 2018
|
|||
2023. Gptscore: Evaluate as you desire
|
|||
2022.Scalinginstruction-finetunedlanguagemodels
|
|||
LangChain: Serp API
|
|||
2023. Natural language dataset generation framework for visualizations powered by large language models
|
|||
LangChain CSV Agent Documentation
|
|||
UIST ’24, October 13–16, 2024, Pittsburgh, PA, USA
|
|||
Chartability Workbook
|
|||
Making Scientific Graphics Acces-sible With Viewplus Iveo®
|
|||
VizAbility: Enhancing Chart Accessibility with LLM-based Conversational Interaction and Serial-Speech Auditory Graphs
|
|||
Received 20 February 2007; revised 12 March 2009; accepted 5 June 2009
|
|||
2022. Chain-of-Thought Prompting Elicits Reasoning in Large Language Models
|
|||
Highcharts 2022. Highcharts accessibility module
|
Showing first page preview. Click "Open Full PDF" to view the complete paper.
Your comment contains inappropriate language and has been rejected.
Are you sure you want to remove this tag? This action cannot be undone.
Someone just favorited a paper!
Comments (0)