VizLinter: A Linter and Fixer Framework for Data Visualization
Publication
Metrics
AI Quick Summary
VizLinter is a framework designed to detect and rectify flaws in data visualizations by applying recognized principles through a linter and automatically correcting errors with a fixer. An in-lab user study demonstrated its effectiveness in identifying and fixing visualization errors.
Paper Preview
Abstract
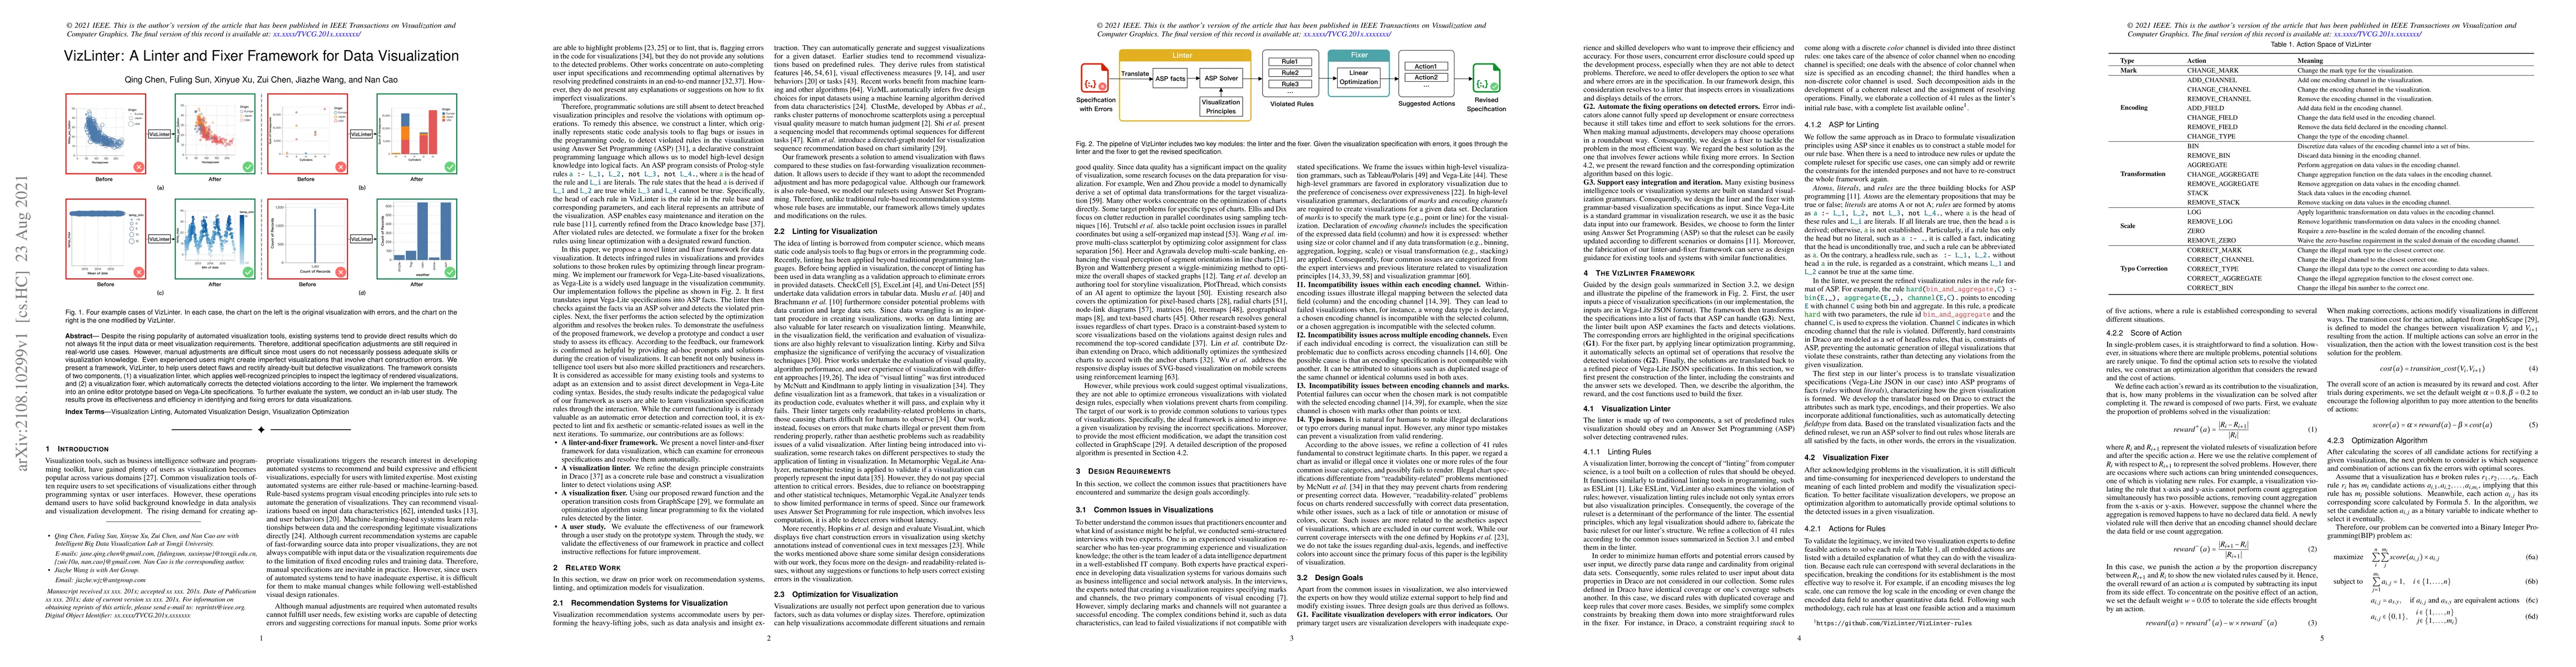
Despite the rising popularity of automated visualization tools, existing systems tend to provide direct results which do not always fit the input data or meet visualization requirements. Therefore, additional specification adjustments are still required in real-world use cases. However, manual adjustments are difficult since most users do not necessarily possess adequate skills or visualization knowledge. Even experienced users might create imperfect visualizations that involve chart construction errors. We present a framework, VizLinter, to help users detect flaws and rectify already-built but defective visualizations. The framework consists of two components, (1) a visualization linter, which applies well-recognized principles to inspect the legitimacy of rendered visualizations, and (2) a visualization fixer, which automatically corrects the detected violations according to the linter. We implement the framework into an online editor prototype based on Vega-Lite specifications. To further evaluate the system, we conduct an in-lab user study. The results prove its effectiveness and efficiency in identifying and fixing errors for data visualizations.
AI Key Findings
Get AI-generated insights about this paper's methodology, results, significance, and more — seven facets brought into focus.
Impact
Paper Details
Authors
PDF Preview
Key Terms
Citation Network
Current paper (gray), citations (green), references (blue)
Display is limited for performance on very large graphs.
Discussion 0