Publication
Metrics
AI Quick Summary
This study uses VLT imaging to map Fe I and Ca II gas emissions in the β Pictoris gas disk, revealing asymmetries and extended gas. The Fe I emission is more extended in the northeast, while Ca II shows the opposite pattern, suggesting different dynamical interactions.
Paper Preview
Abstract
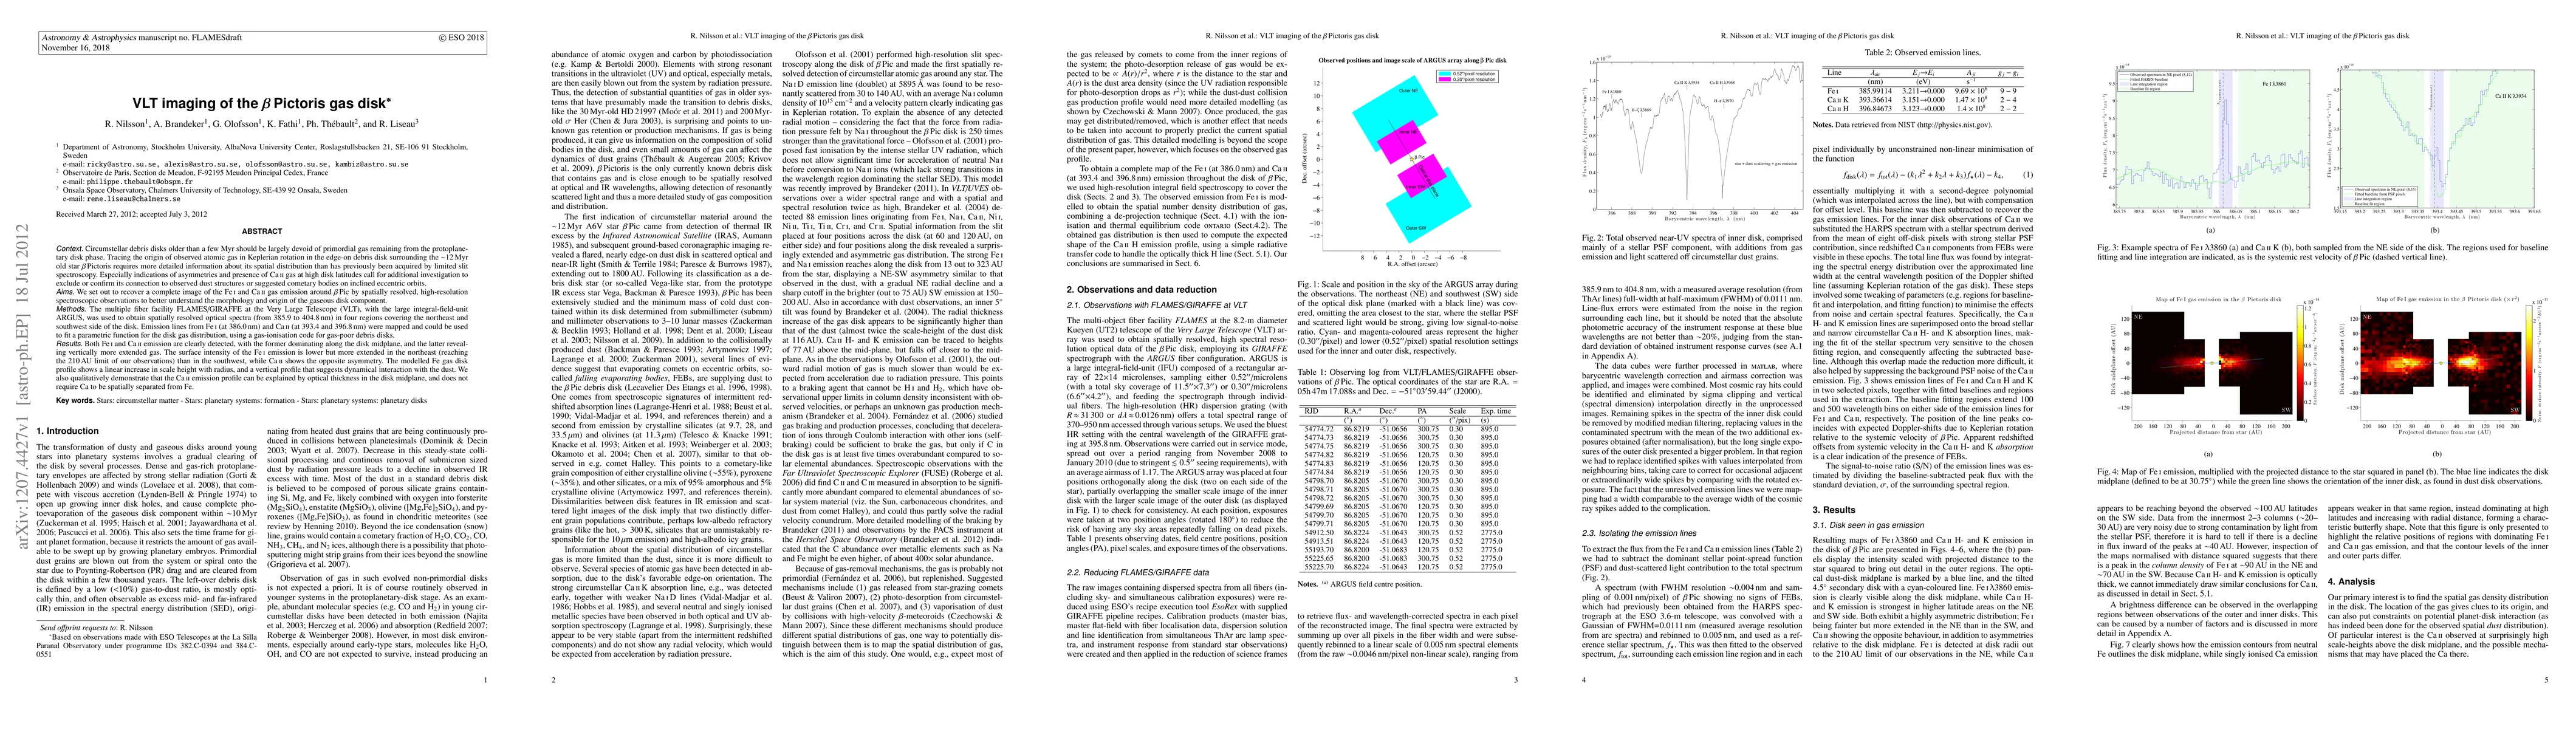
Circumstellar debris disks older than a few Myr should be largely devoid of primordial gas remaining from the protoplanetary disk phase. Tracing the origin of observed atomic gas in Keplerian rotation in the edge-on debris disk surrounding the ~12 Myr old star {\beta} Pictoris requires more detailed information about its spatial distribution than has previously been acquired by limited slit spectroscopy. Especially indications of asymmetries and presence of Ca II gas at high disk latitudes call for additional investigation. We set out to recover a complete image of the Fe I and Ca II gas emission around {\beta} Pic by spatially resolved, high-resolution spectroscopic observations to better understand the morphology and origin of the gaseous disk component. The multiple fiber facility FLAMES/GIRAFFE at the VLT, with the large IFU ARGUS, was used to obtain spatially resolved optical spectra in four regions covering the northeast and southwest side of the disk. Emission lines from Fe I and Ca II were mapped and could be used to fit a parametric function for the disk gas distribution, using a gas-ionisation code for gas-poor debris disks. Both Fe I and Ca II emission are clearly detected, with the former dominating along the disk midplane, and the latter revealing vertically more extended gas. The surface intensity of the Fe I emission is lower but more extended in the northeast (reaching the 210 AU limit of our observations) than in the southwest, while Ca II shows the opposite asymmetry. The modelled Fe gas disk profile shows a linear increase in scale height with radius, and a vertical profile that suggests dynamical interaction with the dust. We also qualitatively demonstrate that the Ca II emission profile can be explained by optical thickness in the disk midplane, and does not require Ca to be spatially separated from Fe. [ABRIDGED]
AI Key Findings
Get AI-generated insights about this paper's methodology, results, significance, and more — seven facets brought into focus.
Impact
Paper Details
PDF Preview
Key Terms
Citation Network
Current paper (gray), citations (green), references (blue)
Display is limited for performance on very large graphs.
Discussion 0