01
MethodologyHow they did it
The research used a log-normal function to describe the volatility distribution of the S&P500 stock index.
The S&P500 stock index shows log-normal volatility distribution from 1984 to 1996, with power-law correlations detected using detrended fluctuation analysis, suggesting a Hurst exponent of approximately 0.9.
The S&P500 stock index shows log-normal volatility distribution from 1984 to 1996, with power-law correlations detected using detrended fluctuation analysis, suggesting a Hurst exponent of approximately 0.9.
The research used a log-normal function to describe the volatility distribution of the S&P500 stock index. More in Methodology →
The main finding is that the volatility distribution can be well described by a log-normal function. — Detrended fluctuation analysis showed power-law correlation with Hurst exponent α≈0.9. More in Key Results →
This research is important because it provides insights into the underlying mechanisms driving stock market volatility. More in Significance →
The study only analyzed data from 1984 to 1996, which may not be representative of all time periods. — The use of a log-normal function may oversimplify the complexity of real-world markets. More in Limitations →
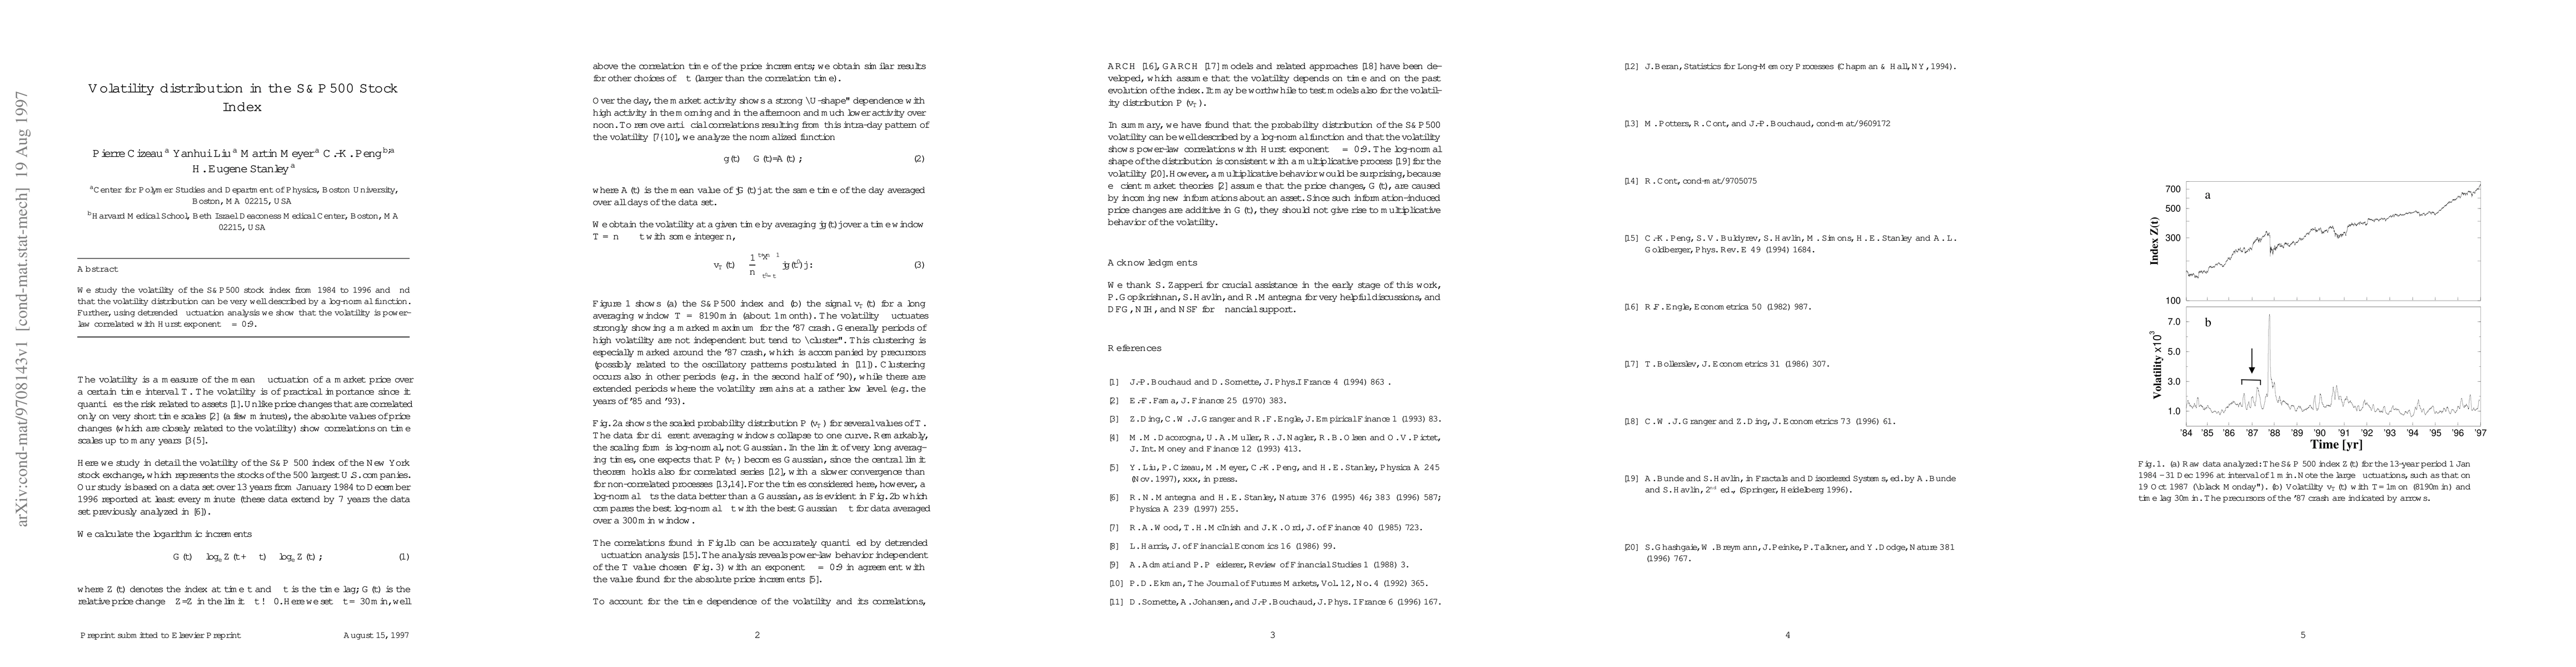
We study the volatility of the S&P500 stock index from 1984 to 1996 and find that the volatility distribution can be very well described by a log-normal function. Further, using detrended fluctuation analysis we show that the volatility is power-law correlated with Hurst exponent $\alpha\cong0.9$.
Seven facets of this paper, analysed and brought into focus by AI.
This research is important because it provides insights into the underlying mechanisms driving stock market volatility.
The research used a log-normal function to describe the volatility distribution of the S&P500 stock index.
This research is important because it provides insights into the underlying mechanisms driving stock market volatility.
The study made a significant technical contribution by demonstrating the power-law correlation between volatility and Hurst exponent α.
This research is novel because it provides new insights into the nature of stock market volatility, which has important implications for risk management and portfolio optimization.
Current paper (gray), citations (green), references (blue)
Display is limited for performance on very large graphs.
Discussion 0