Publication
Metrics
AI Quick Summary
This study uses molecular dynamics simulations to analyze the volume behavior of supercooled water under high pressure, revealing a concave-downward curvature in volume-temperature plots at pressures up to 1.0 GPa, particularly between 180 K and 220 K, consistent with experimental findings. Below the glass transition temperature of around 180 K, the volume shows a concave-upward trend, and no crystallization occurs.
Paper Preview
Abstract
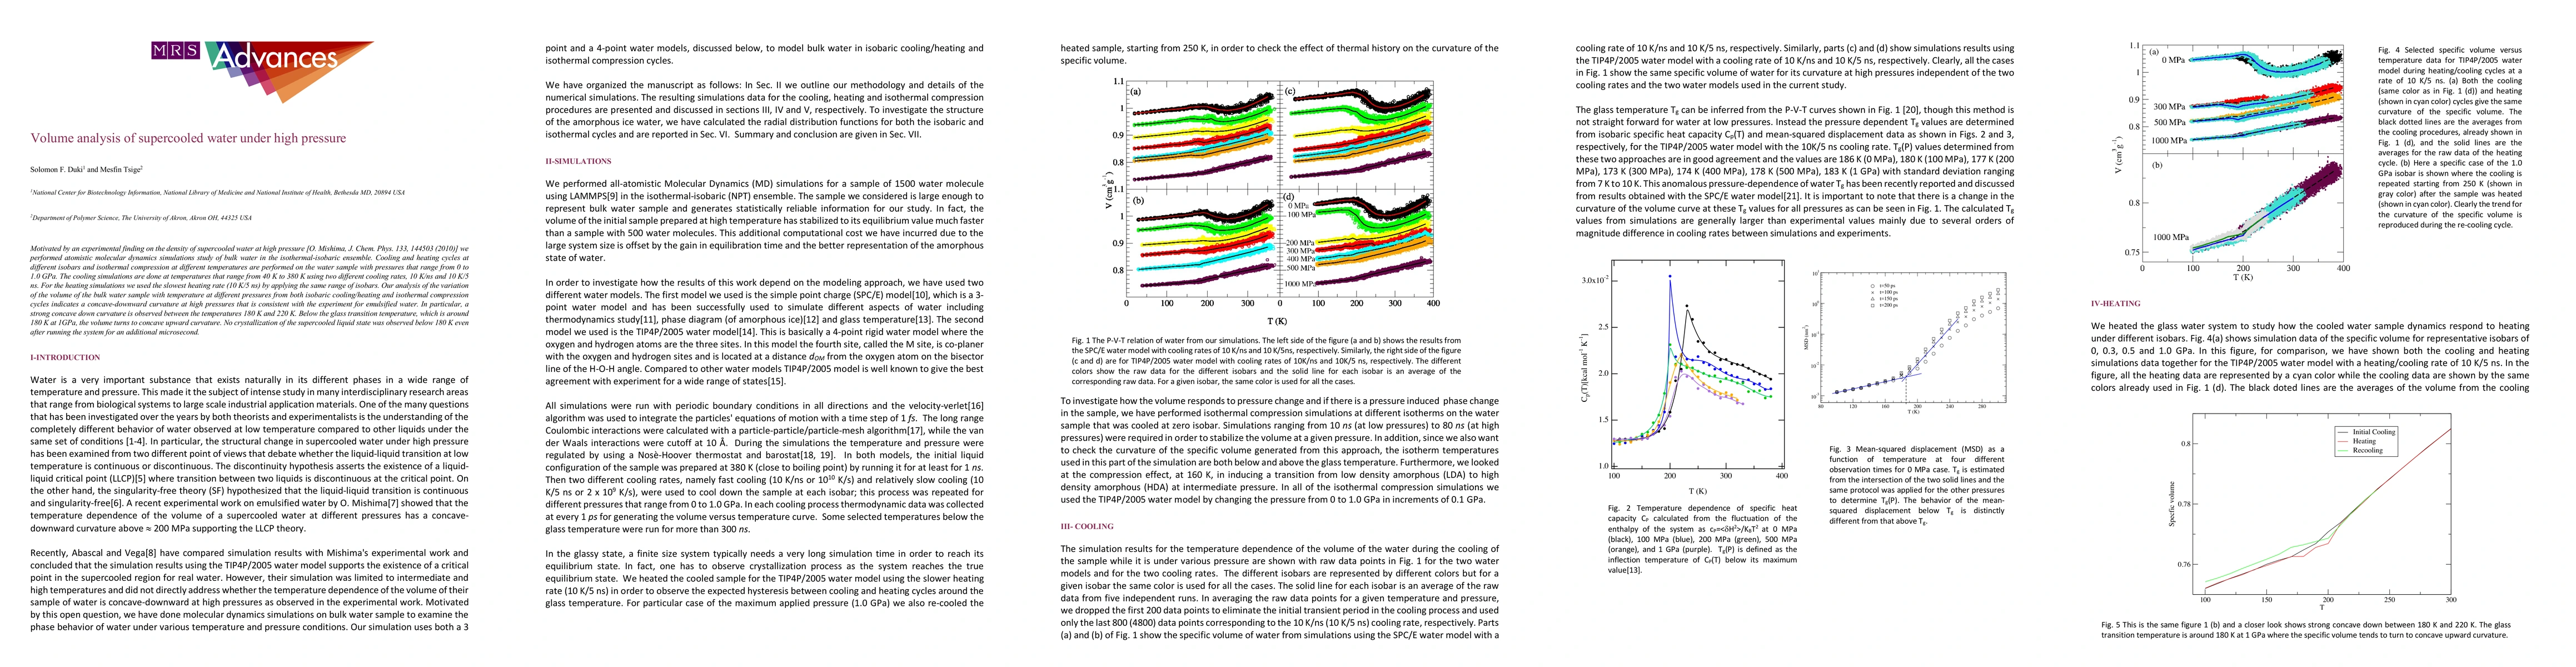
Motivated by an experimental finding on the density of supercooled water at high pressure [O. Mishima, J. Chem. Phys. 133, 144503 (2010)] we performed atomistic molecular dynamics simulations study of bulk water in the isothermal-isobaric ensemble. Cooling and heating cycles at different isobars and isothermal compression at different temperatures are performed on the water sample with pressures that range from 0 to 1.0 GPa. The cooling simulations are done at temperatures that range from 40 K to 380 K using two different cooling rates, 10 K/ns and 10 K/5 ns. For the heating simulations we used the slowest heating rate (10 K/5 ns) by applying the same range of isobars. Our analysis of the variation of the volume of the bulk water sample with temperature at different pressures from both isobaric cooling/heating and isothermal compression cycles indicates a concave-downward curvature at high pressures that is consistent with the experiment for emulsified water. In particular, a strong concave down curvature is observed between the temperatures 180 K and 220 K. Below the glass transition temperature, which is around 180 K at 1GPa, the volume turns to concave upward curvature. No crystallization of the supercooled liquid state was observed below 180 K even after running the system for an additional microsecond.
AI Key Findings
Get AI-generated insights about this paper's methodology, results, significance, and more — seven facets brought into focus.
Impact
Paper Details
PDF Preview
Key Terms
Citation Network
Current paper (gray), citations (green), references (blue)
Display is limited for performance on very large graphs.
Discussion 0