Volume Approximation of Strongly ${\mathbb C}$-Convex Domains by Random Polyhedra
Publication
Metrics
AI Quick Summary
This paper investigates the volume approximation of strongly $\mathbb{C}$-convex domains using random polyhedra created from Poisson or binomial point processes on the domain's boundary. The study determines the error rate in this approximation and conjectures the precise value of the minimal limiting constant, which is linked to the Hausdorff dimension and the M\"obius-Fefferman measure.
Paper Preview
Abstract
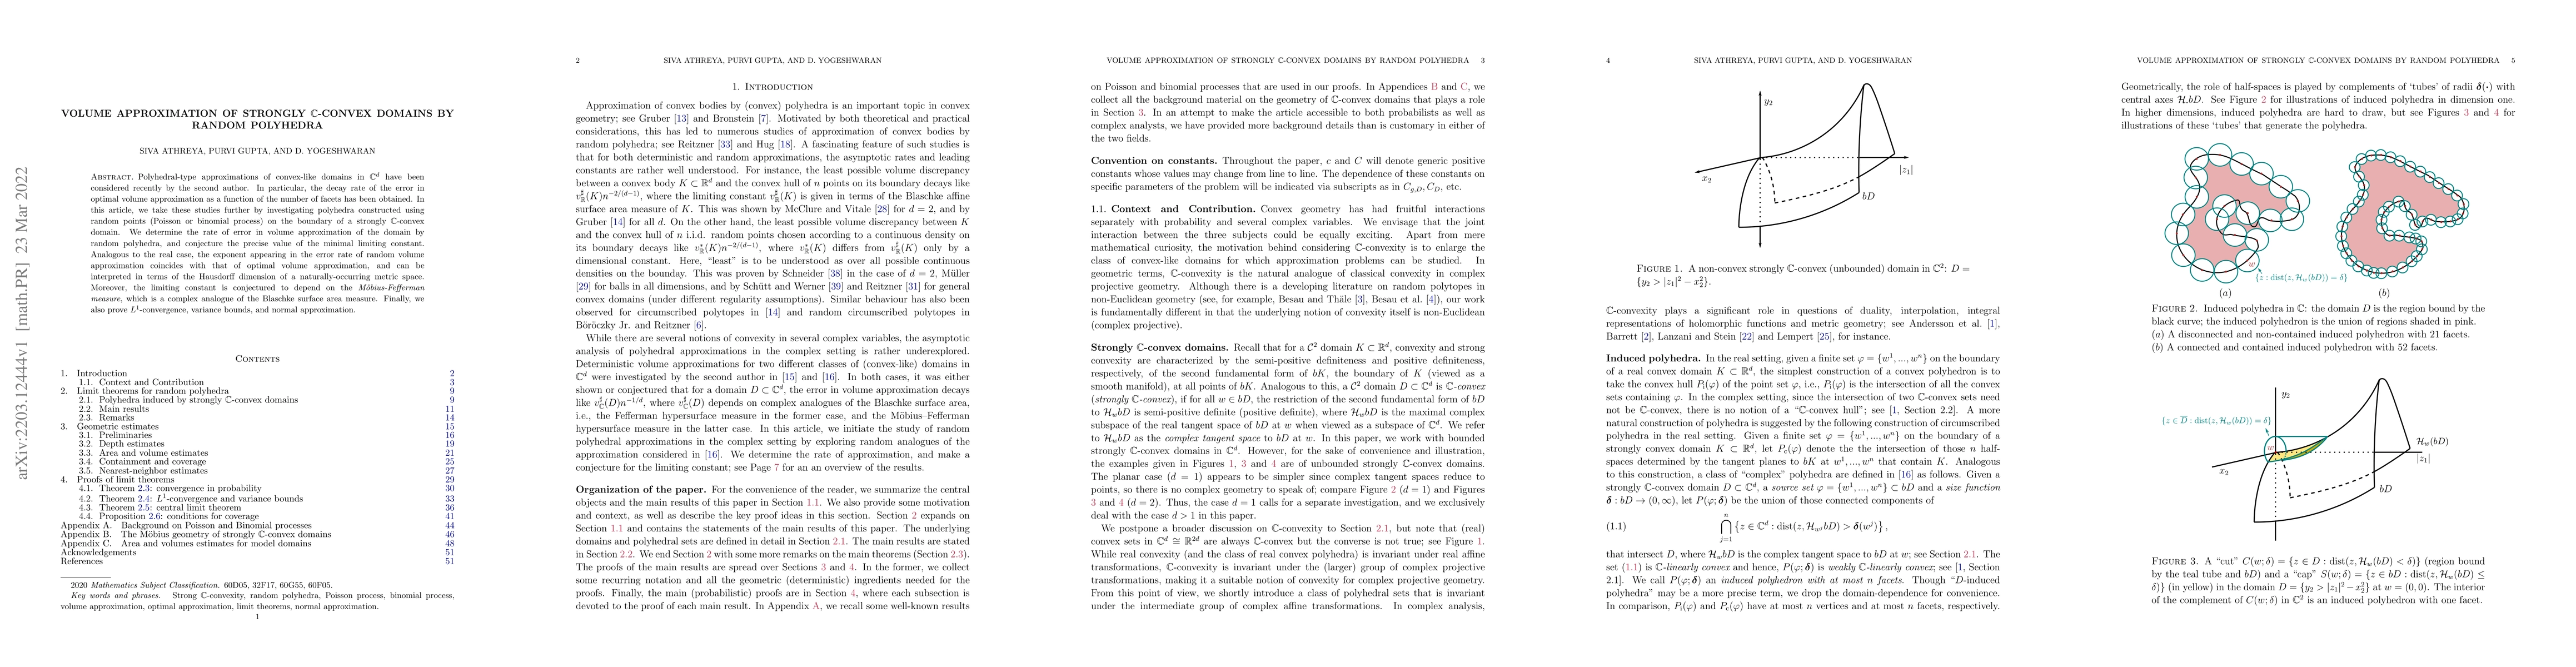
Polyhedral-type approximations of convex-like domains in $\mathbb{C}^d$ have been considered recently by the second author. In particular, the decay rate of the error in optimal volume approximation as a function of the number of facets has been obtained. In this article, we take these studies further by investigating polyhedra constructed using random points (Poisson or binomial process) on the boundary of a strongly $\mathbb{C}$-convex domain. We determine the rate of error in volume approximation of the domain by random polyhedra, and conjecture the precise value of the minimal limiting constant. Analogous to the real case, the exponent appearing in the error rate of random volume approximation coincides with that of optimal volume approximation, and can be interpreted in terms of the Hausdorff dimension of a naturally-occurring metric space. Moreover, the limiting constant is conjectured to depend on the M\"obius-Fefferman measure, which is a complex analogue of the Blaschke surface area measure. Finally, we also prove $L^1$-convergence, variance bounds, and normal approximation.
AI Key Findings
Get AI-generated insights about this paper's methodology, results, significance, and more — seven facets brought into focus.
Impact
Paper Details
Authors
PDF Preview
Key Terms
Citation Network
Current paper (gray), citations (green), references (blue)
Display is limited for performance on very large graphs.
Discussion 0