Publication
Metrics
AI Quick Summary
This paper analyzes microlensing events in the Galactic bulge using VVV Survey near-IR data, finding a homogeneous distribution increasing towards the Galactic center with a slight asymmetry towards negative longitudes. The timescale distribution peaks at 17.4 days for the complete sample and 20.7 days for Red Clump stars, suggesting a possible relation to the bar's inclination.
Paper Preview
Abstract
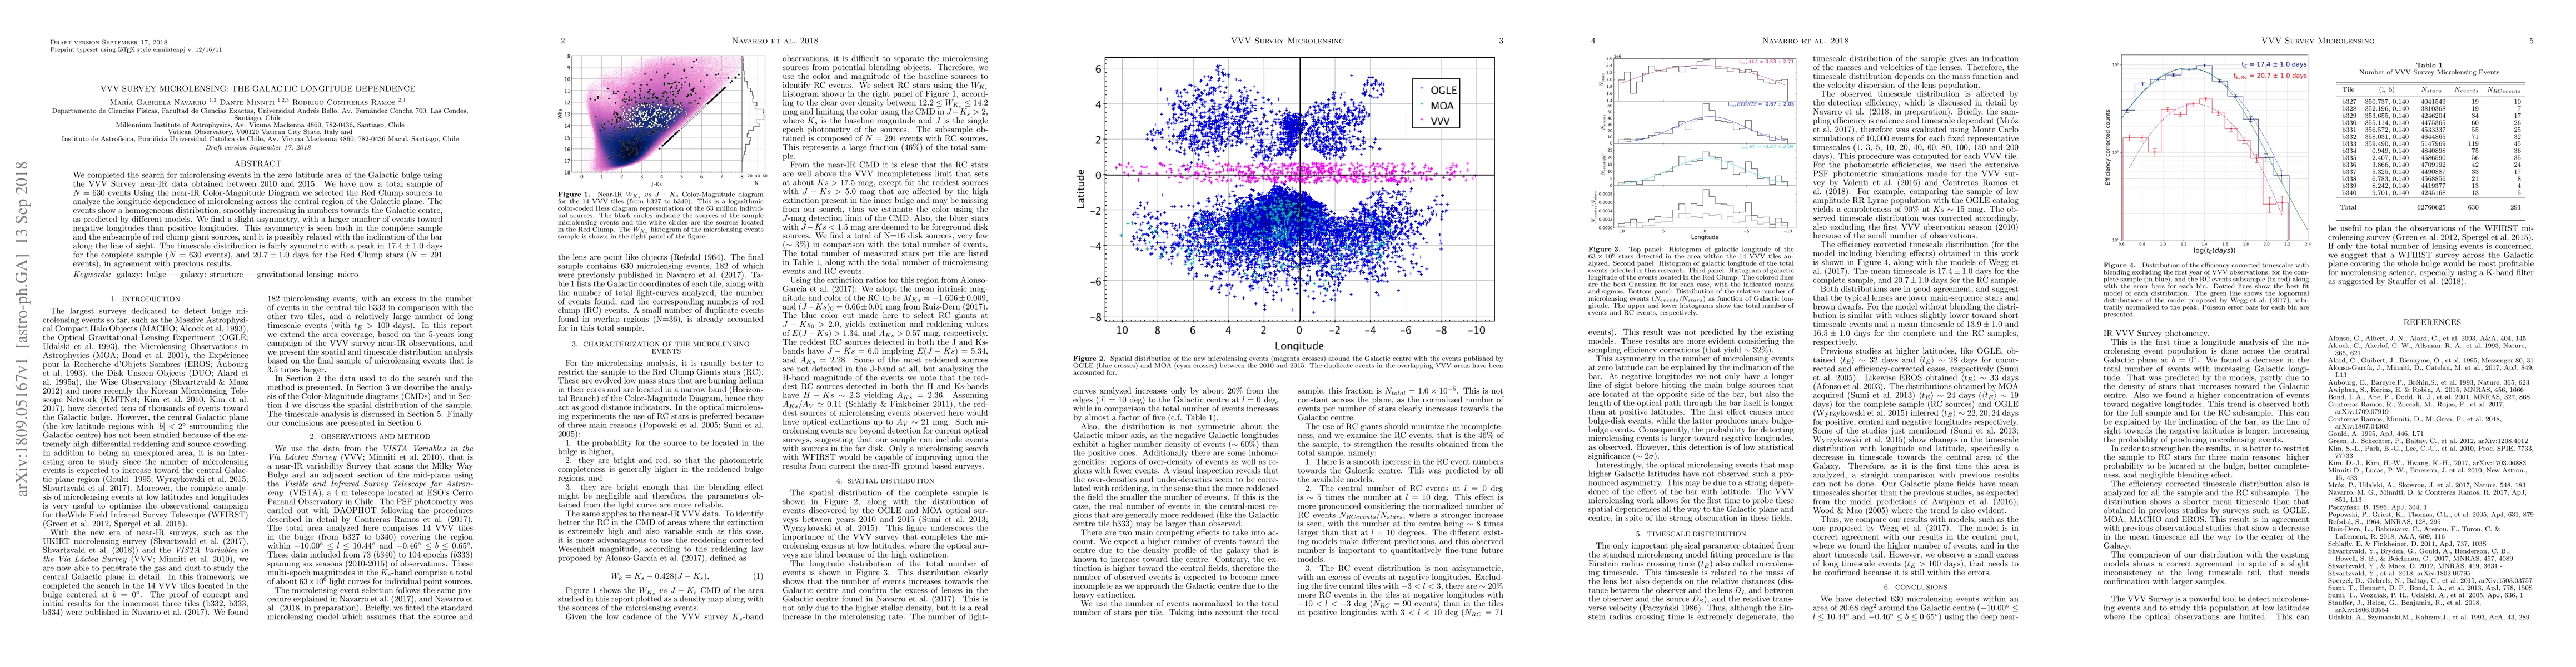
We completed the search for microlensing events in the zero latitude area of the Galactic bulge using the VVV Survey near-IR data obtained between 2010 and 2015. We have now a total sample of N = 630 events Using the near-IR Color-Magnitude Diagram we selected the Red Clump sources to analyze the longitude dependence of microlensing across the central region of the Galactic plane. The events show a homogeneous distribution, smoothly increasing in numbers towards the Galactic centre, as predicted by different models. We find a slight asymmetry, with a larger number of events toward negative longitudes than positive longitudes. This asymmetry is seen both in the complete sample and the subsample of red clump giant sources, and it is possibly related with the inclination of the bar along the line of sight. The timescale distribution is fairly symmetric with a peak in 17.4 $\pm$ 1.0 days for the complete sample (N = 630 events), and 20.7 $\pm$ 1.0 days for the Red Clump stars (N = 291 events), in agreement with previous results.
AI Key Findings
Get AI-generated insights about this paper's methodology, results, significance, and more — seven facets brought into focus.
Impact
Paper Details
PDF Preview
Key Terms
Citation Network
Current paper (gray), citations (green), references (blue)
Display is limited for performance on very large graphs.
Discussion 0