Summary
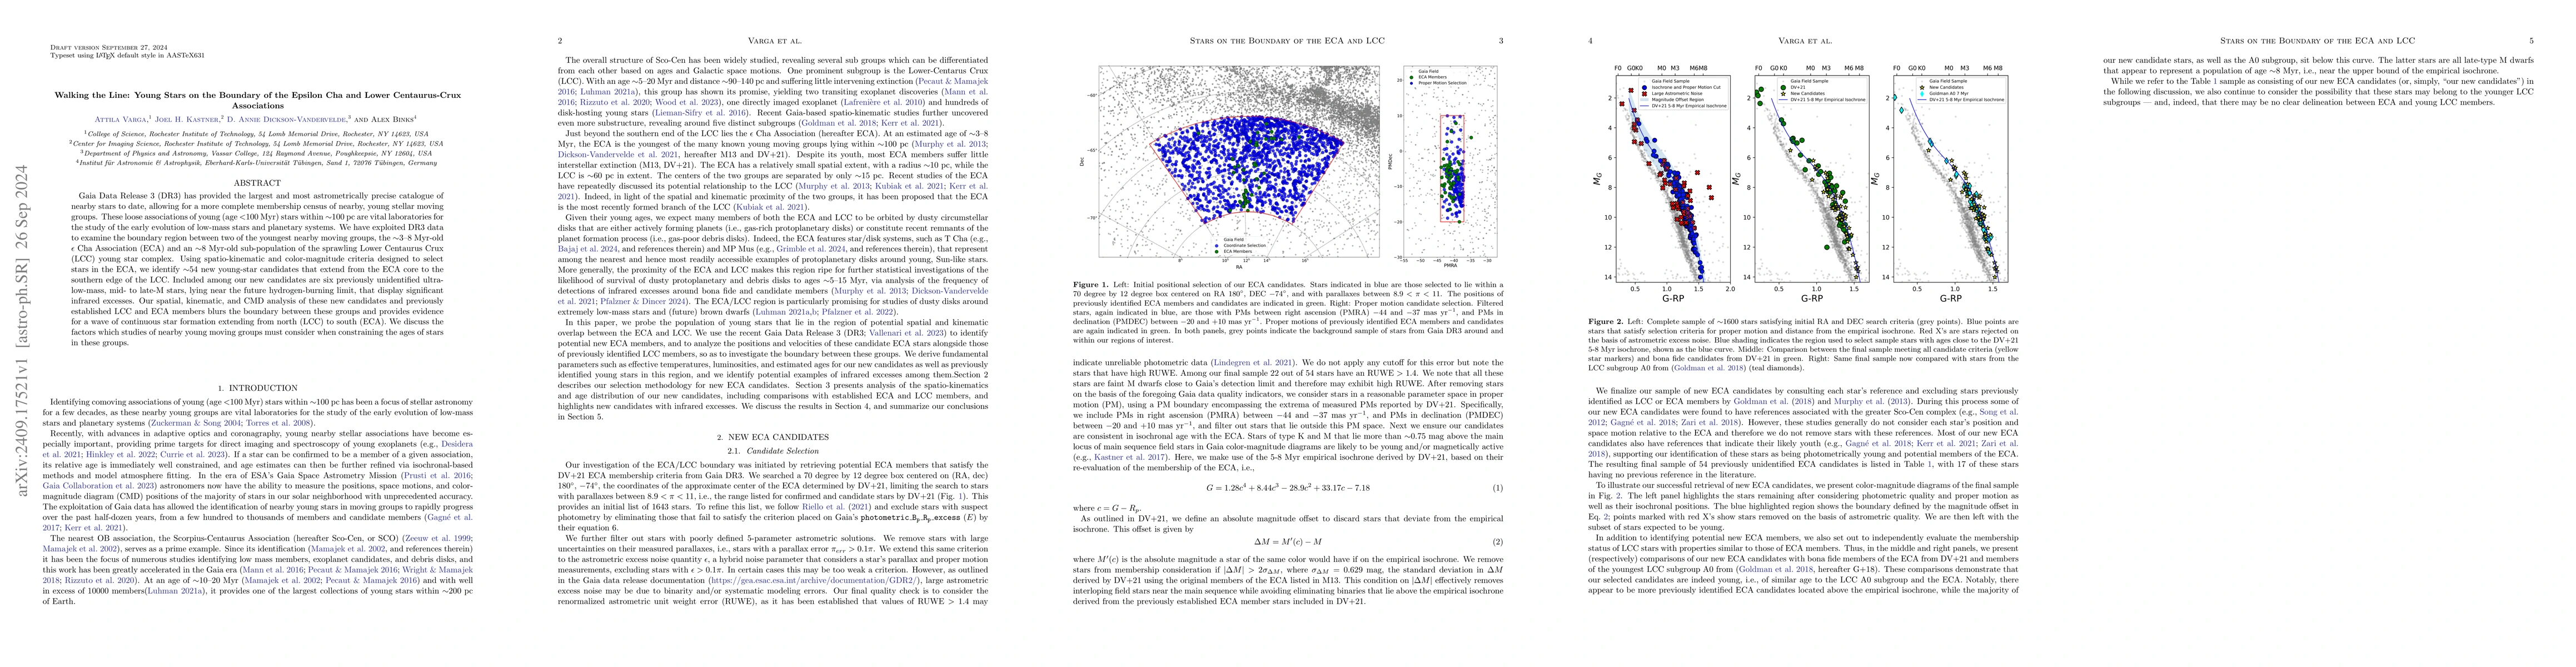
Gaia Data Release 3 (DR3) has provided the largest and most astrometrically precise catalogue of nearby stars to date, allowing for a more complete membership census of nearby, young stellar moving groups. These loose associations of young (age $<$100 Myr) stars within $\sim$100 pc are vital laboratories for the study of the early evolution of low-mass stars and planetary systems. We have exploited DR3 data to examine the boundary region between two of the youngest nearby moving groups, the $\sim$3--8 Myr-old $\epsilon$ Cha Association (ECA) and an $\sim$8 Myr-old sub-population of the sprawling Lower Centaurus Crux (LCC) young star complex. Using spatio-kinematic and color-magnitude criteria designed to select stars in the ECA, we identify $\sim$54 new young-star candidates that extend from the ECA core to the southern edge of the LCC. Included among our new candidates are six previously unidentified ultra-low-mass, mid- to late-M stars, lying near the future hydrogen-burning limit, that display significant infrared excesses. Our spatial, kinematic, and CMD analysis of these new candidates and previously established LCC and ECA members blurs the boundary between these groups and provides evidence for a wave of continuous star formation extending from north (LCC) to south (ECA). We discuss the factors which studies of nearby young moving groups must consider when constraining the ages of stars in these groups.
AI Key Findings
Get AI-generated insights about this paper's methodology, results, and significance.
Paper Details
PDF Preview
Citation Network
Current paper (gray), citations (green), references (blue)
Display is limited for performance on very large graphs.
No citations found for this paper.
Comments (0)