Summary
Exploratory data analysis is often used to test the goodness-of-fit of sample observations to specific target distributions. A few such graphical tools have been extensively used to detect subexponential or heavy-tailed behavior in observed data. In this paper we discuss asymptotic limit behavior of two such plotting tools: the quantile-quantile plot and the mean excess plot. The weak consistency of these plots to fixed limit sets in an appropriate topology of $\mathbb{R}^2$ has been shown in Das and Resnick (Stoch. Models 24 (2008) 103-132) and Ghosh and Resnick (Stochastic Process. Appl. 120 (2010) 1492-1517). In this paper we find asymptotic distributional limits for these plots when the underlying distributions have regularly varying right-tails. As an application we construct confidence bounds around the plots which enable us to statistically test whether the underlying distribution is heavy-tailed or not.
AI Key Findings
Get AI-generated insights about this paper's methodology, results, and significance.
Paper Details
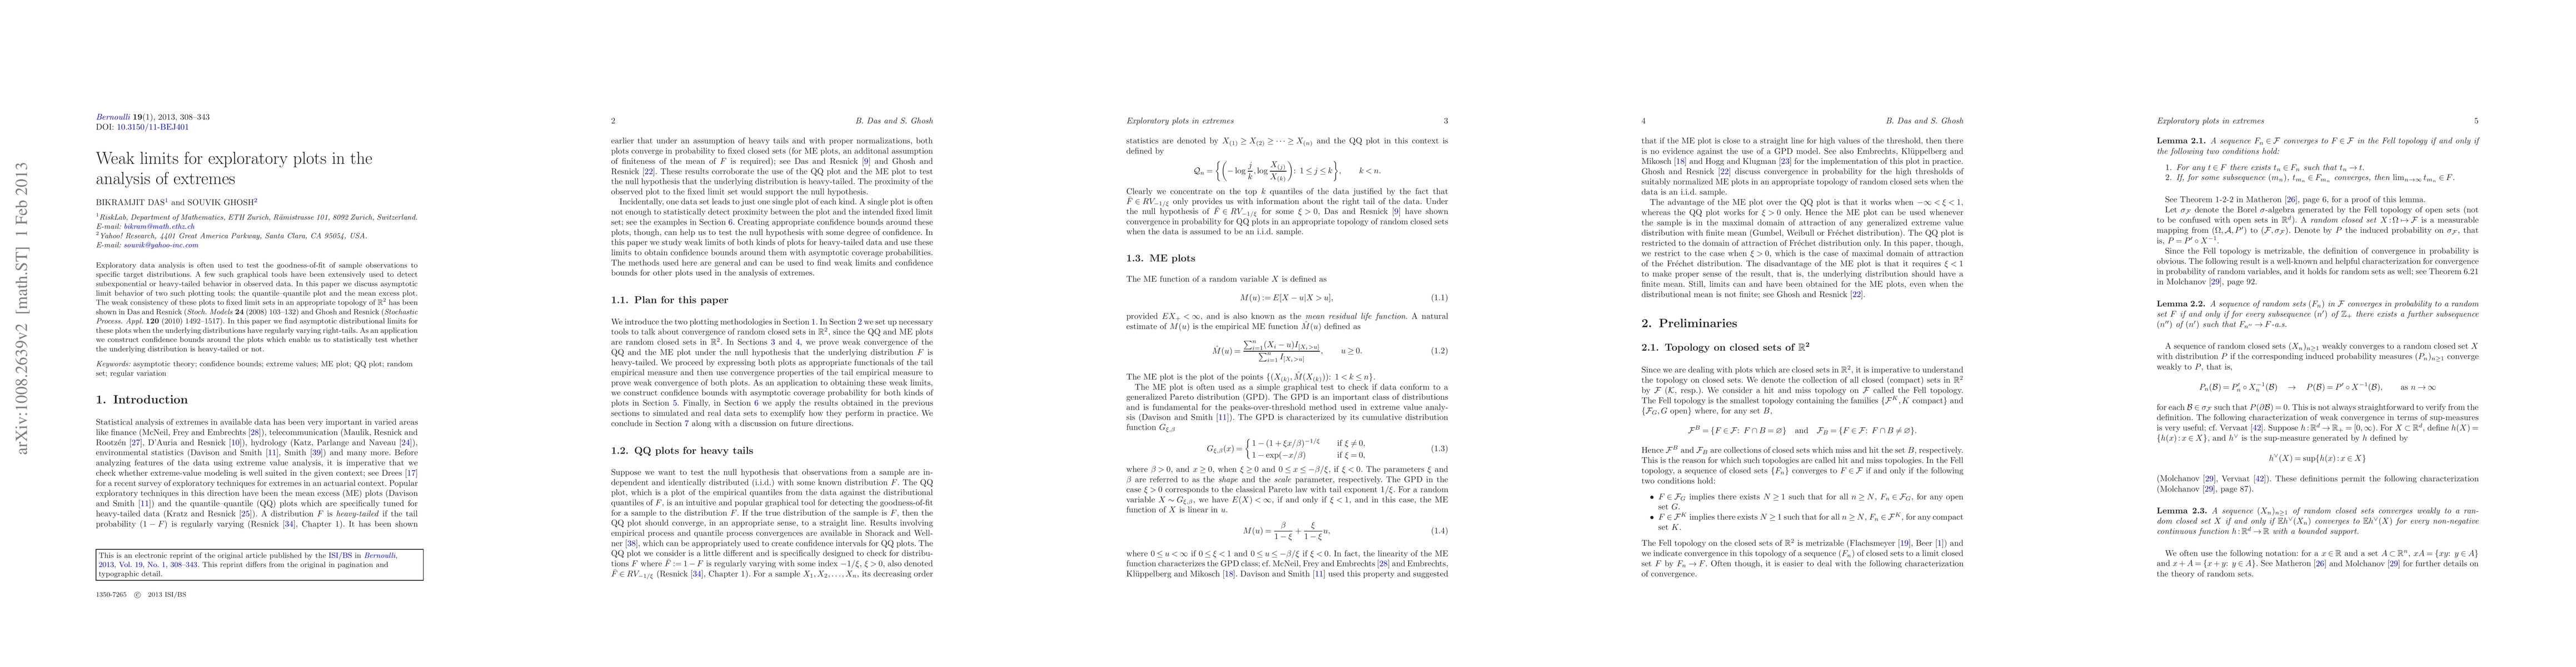
PDF Preview
Key Terms
Citation Network
Current paper (gray), citations (green), references (blue)
Display is limited for performance on very large graphs.
Similar Papers
Found 4 papers| Title | Authors | Year | Actions |
|---|
Comments (0)