Web-Based Multi-View Visualizations for Aggregated Statistics
Publication
Metrics
AI Quick Summary
This research paper presents a web-based visualization tool that combines multiple data sets into coordinated charts, allowing users to easily compare different statistics and indicators. It enables users to add personal data for enrichment and provides interactive features such as mouse-over effects.
Paper Preview
Abstract
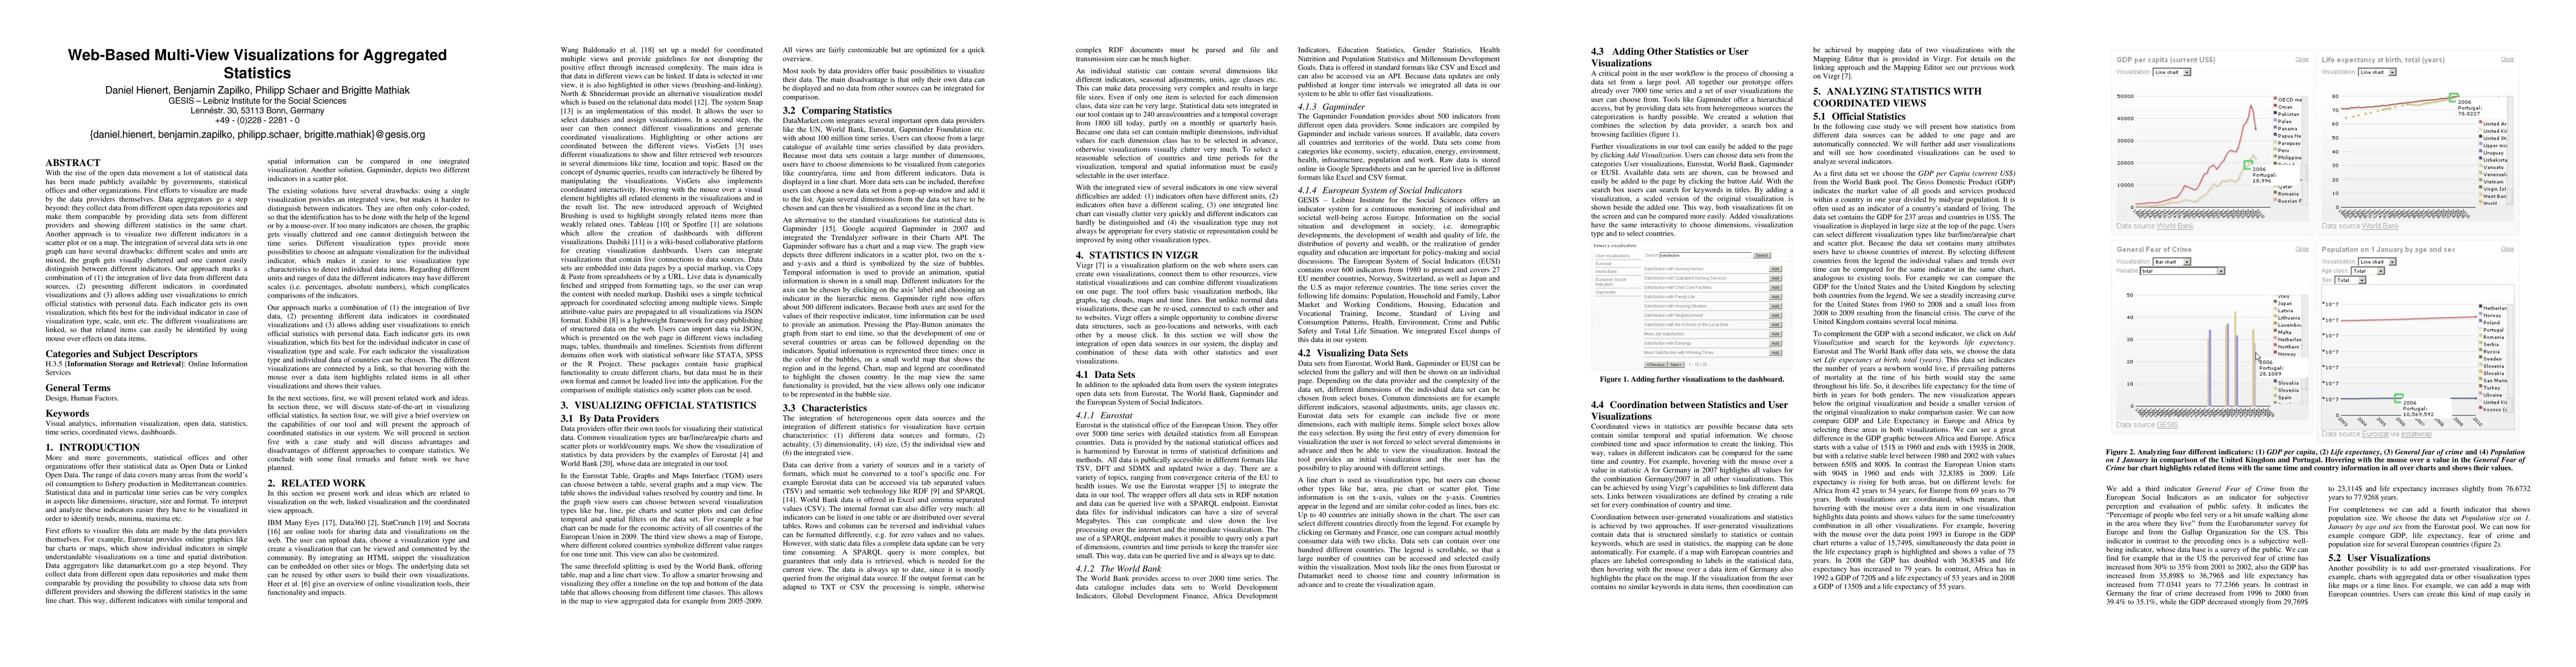
With the rise of the open data movement a lot of statistical data has been made publicly available by governments, statistical offices and other organizations. First efforts to visualize are made by the data providers themselves. Data aggregators go a step beyond: they collect data from different open data repositories and make them comparable by providing data sets from different providers and showing different statistics in the same chart. Another approach is to visualize two different indicators in a scatter plot or on a map. The integration of several data sets in one graph can have several drawbacks: different scales and units are mixed, the graph gets visually cluttered and one cannot easily distinguish between different indicators. Our approach marks a combination of (1) the integration of live data from different data sources, (2) presenting different indicators in coordinated visualizations and (3) allows adding user visualizations to enrich official statistics with personal data. Each indicator gets its own visualization, which fits best for the individual indicator in case of visualization type, scale, unit etc. The different visualizations are linked, so that related items can easily be identified by using mouse over effects on data items.
AI Key Findings
Get AI-generated insights about this paper's methodology, results, significance, and more — seven facets brought into focus.
Impact
Paper Details
PDF Preview
Key Terms
Citation Network
Current paper (gray), citations (green), references (blue)
Display is limited for performance on very large graphs.
Discussion 0