What do different evaluation metrics tell us about saliency models?
Publication
Metrics
AI Quick Summary
This paper analyzes eight evaluation metrics for saliency models, highlighting their properties and differences in ranking models based on factors like false positives, viewing biases, and spatial deviations. It provides recommendations for selecting appropriate metrics based on specific research assumptions and applications.
Paper Preview
Abstract
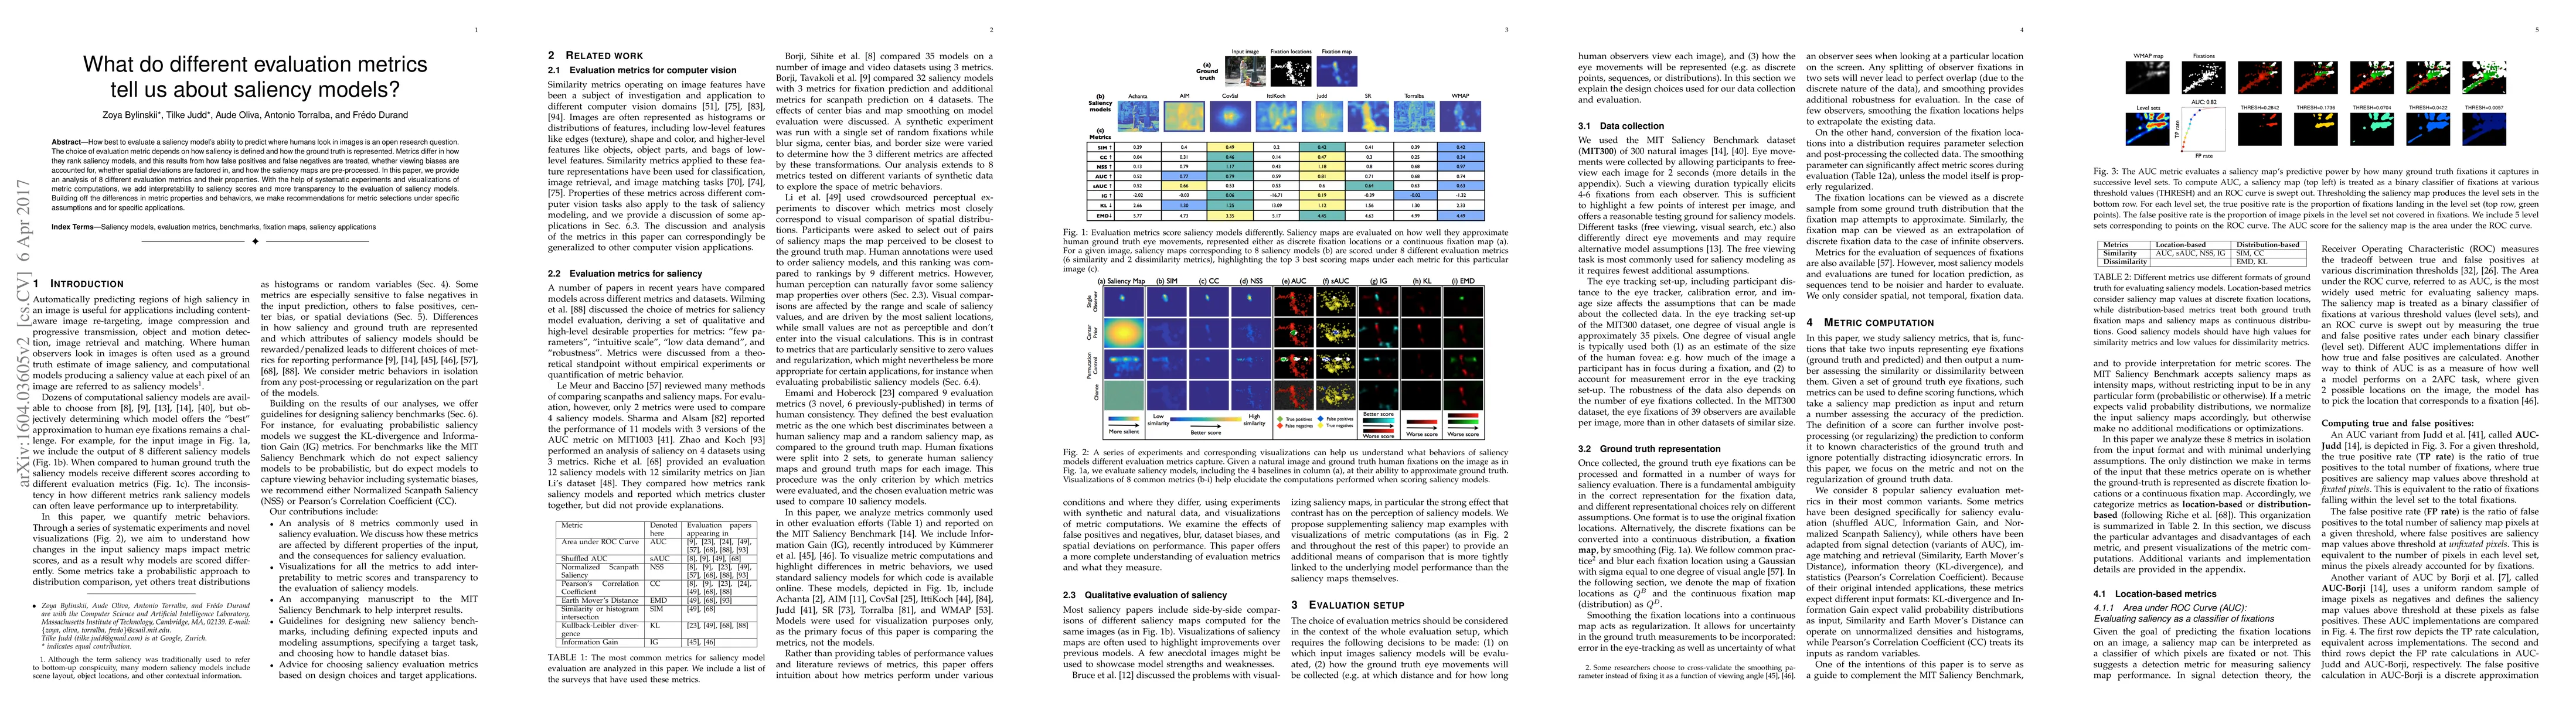
How best to evaluate a saliency model's ability to predict where humans look in images is an open research question. The choice of evaluation metric depends on how saliency is defined and how the ground truth is represented. Metrics differ in how they rank saliency models, and this results from how false positives and false negatives are treated, whether viewing biases are accounted for, whether spatial deviations are factored in, and how the saliency maps are pre-processed. In this paper, we provide an analysis of 8 different evaluation metrics and their properties. With the help of systematic experiments and visualizations of metric computations, we add interpretability to saliency scores and more transparency to the evaluation of saliency models. Building off the differences in metric properties and behaviors, we make recommendations for metric selections under specific assumptions and for specific applications.
AI Key Findings
Get AI-generated insights about this paper's methodology, results, significance, and more — seven facets brought into focus.
Impact
Paper Details
PDF Preview
Key Terms
Citation Network
Current paper (gray), citations (green), references (blue)
Display is limited for performance on very large graphs.
Discussion 0