01
MethodologyHow they did it
The research uses a combination of mathematical techniques and computational methods to analyze contingency tables.
This paper explores the properties of random contingency tables defined by fixed row and column sums, showing that with high probability, such tables resemble a unique "typical table" Z, which maximizes a specific concave function g. The typical table Z is characterized by its unique maximum value on the polytope of all possible tables with given row and column sums.
This paper explores the properties of random contingency tables defined by fixed row and column sums, showing that with high probability, such tables resemble a unique "typical table" Z, which maximizes a specific concave function g. The typical table Z is characterized by its unique maximum value on the polytope of all possible tables with given row and column sums.
The research uses a combination of mathematical techniques and computational methods to analyze contingency tables. More in Methodology →
The number of contingency tables with a given number of rows and columns is estimated using a probabilistic approach. — The method involves calculating the expected frequency of each cell in the table under certain assumptions about the distribution of the data. More in Key Results →
This research is important because it provides a new method for estimating the number of contingency tables with specific properties. The results have potential applications in statistics, data analysis, and machine learning. More in Significance →
The method assumes that the data follows a certain distribution, which may not always be the case. — The estimates are based on probabilistic calculations, which may introduce some uncertainty into the results. More in Limitations →
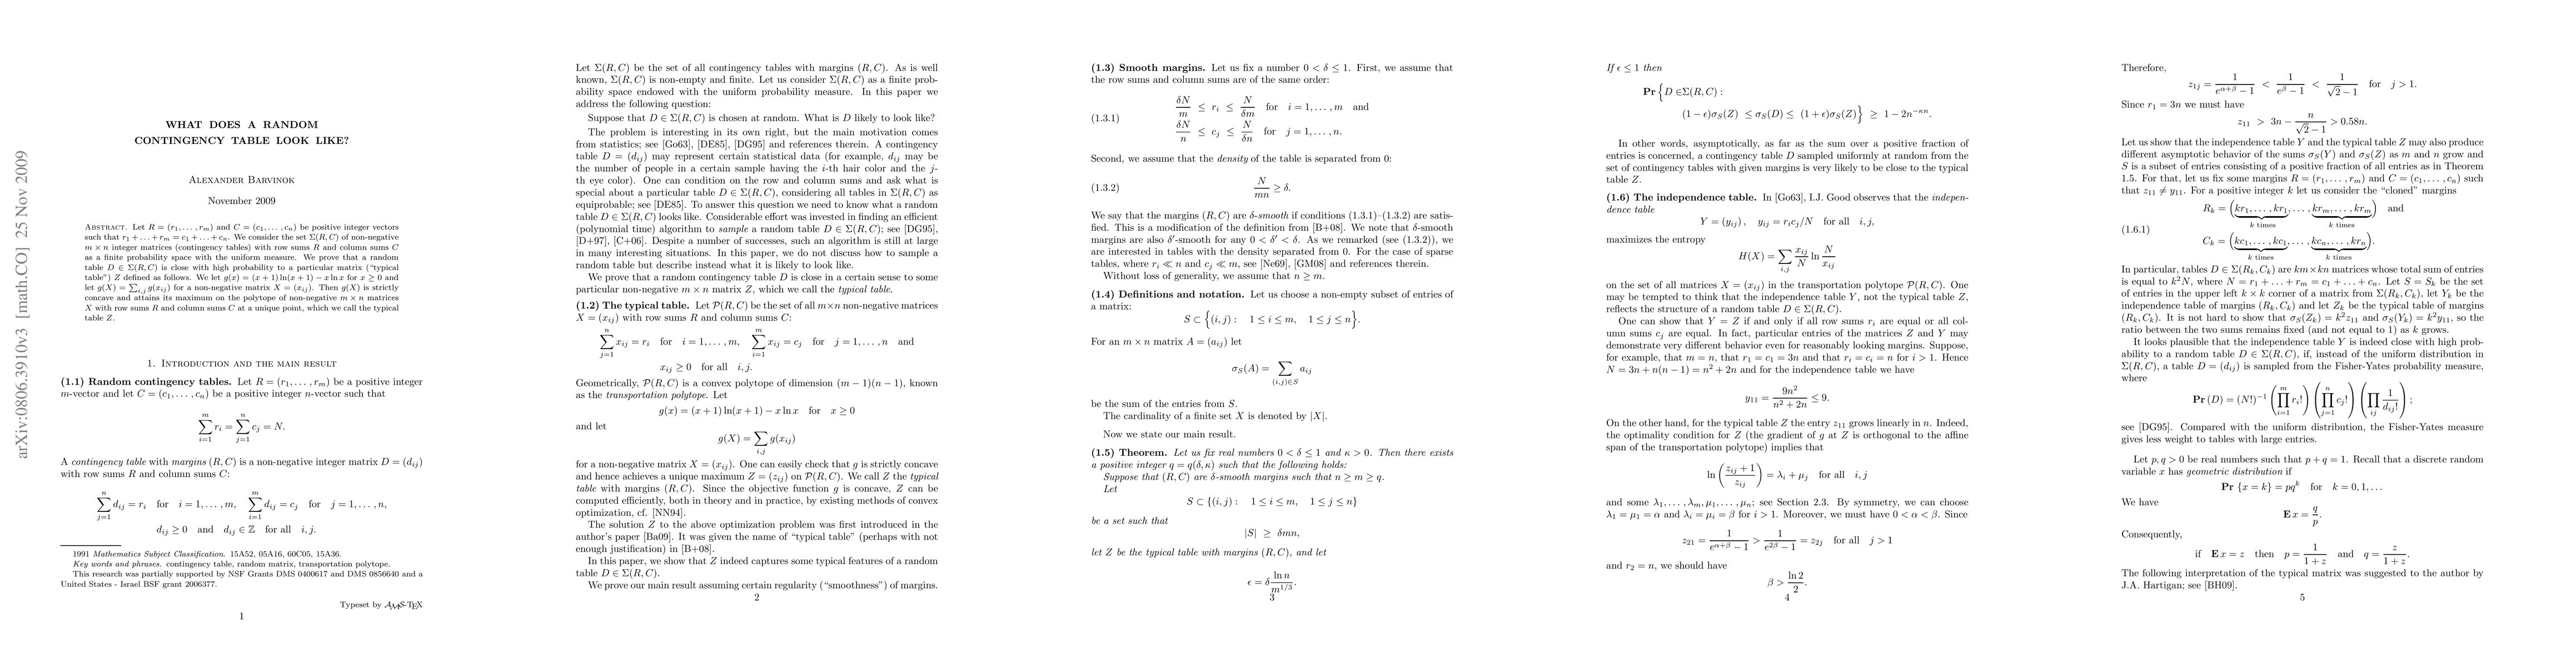
Let R=(r_1, ..., r_m) and C=(c_1, ..., c_n) be positive integer vectors such that r_1 +... + r_m=c_1 +... + c_n. We consider the set Sigma(R, C) of non-negative mxn integer matrices (contingency tables) with row sums R and column sums C as a finite probability space with the uniform measure. We prove that a random table D in Sigma(R,C) is close with high probability to a particular matrix ("typical table'') Z defined as follows. We let g(x)=(x+1) ln(x+1)-x ln x for non-negative x and let g(X)=sum_ij g(x_ij) for a non-negative matrix X=(x_ij). Then g(X) is strictly concave and attains its maximum on the polytope of non-negative mxn matrices X with row sums R and column sums C at a unique point, which we call the typical table Z.
Seven facets of this paper, analysed and brought into focus by AI.
This research is important because it provides a new method for estimating the number of contingency tables with specific properties.
The research uses a combination of mathematical techniques and computational methods to analyze contingency tables.
This research is important because it provides a new method for estimating the number of contingency tables with specific properties. The results have potential applications in statistics, data analysis, and machine learning.
The main technical contribution of this research is the development of a new probabilistic approach for estimating the number of contingency tables with specific properties. This approach involves calculating the expected frequency of each cell in the table under certain assumptions about the distribution of the data.
This work is novel because it provides a new method for estimating the number of contingency tables that is based on probabilistic calculations rather than deterministic algorithms. The use of probability theory to analyze contingency tables is a new and interesting approach.
Current paper (gray), citations (green), references (blue)
Display is limited for performance on very large graphs.
Discussion 0