Publication
Metrics
AI Quick Summary
This paper surveys various uses of directed acyclic graphs (DAGs) to represent probabilistic causality, detailing the formal and informal semantics of each representation. It suggests that the most effective representation includes augmented DAGs with nodes for non-stochastic intervention indicators.
Paper Preview
Abstract
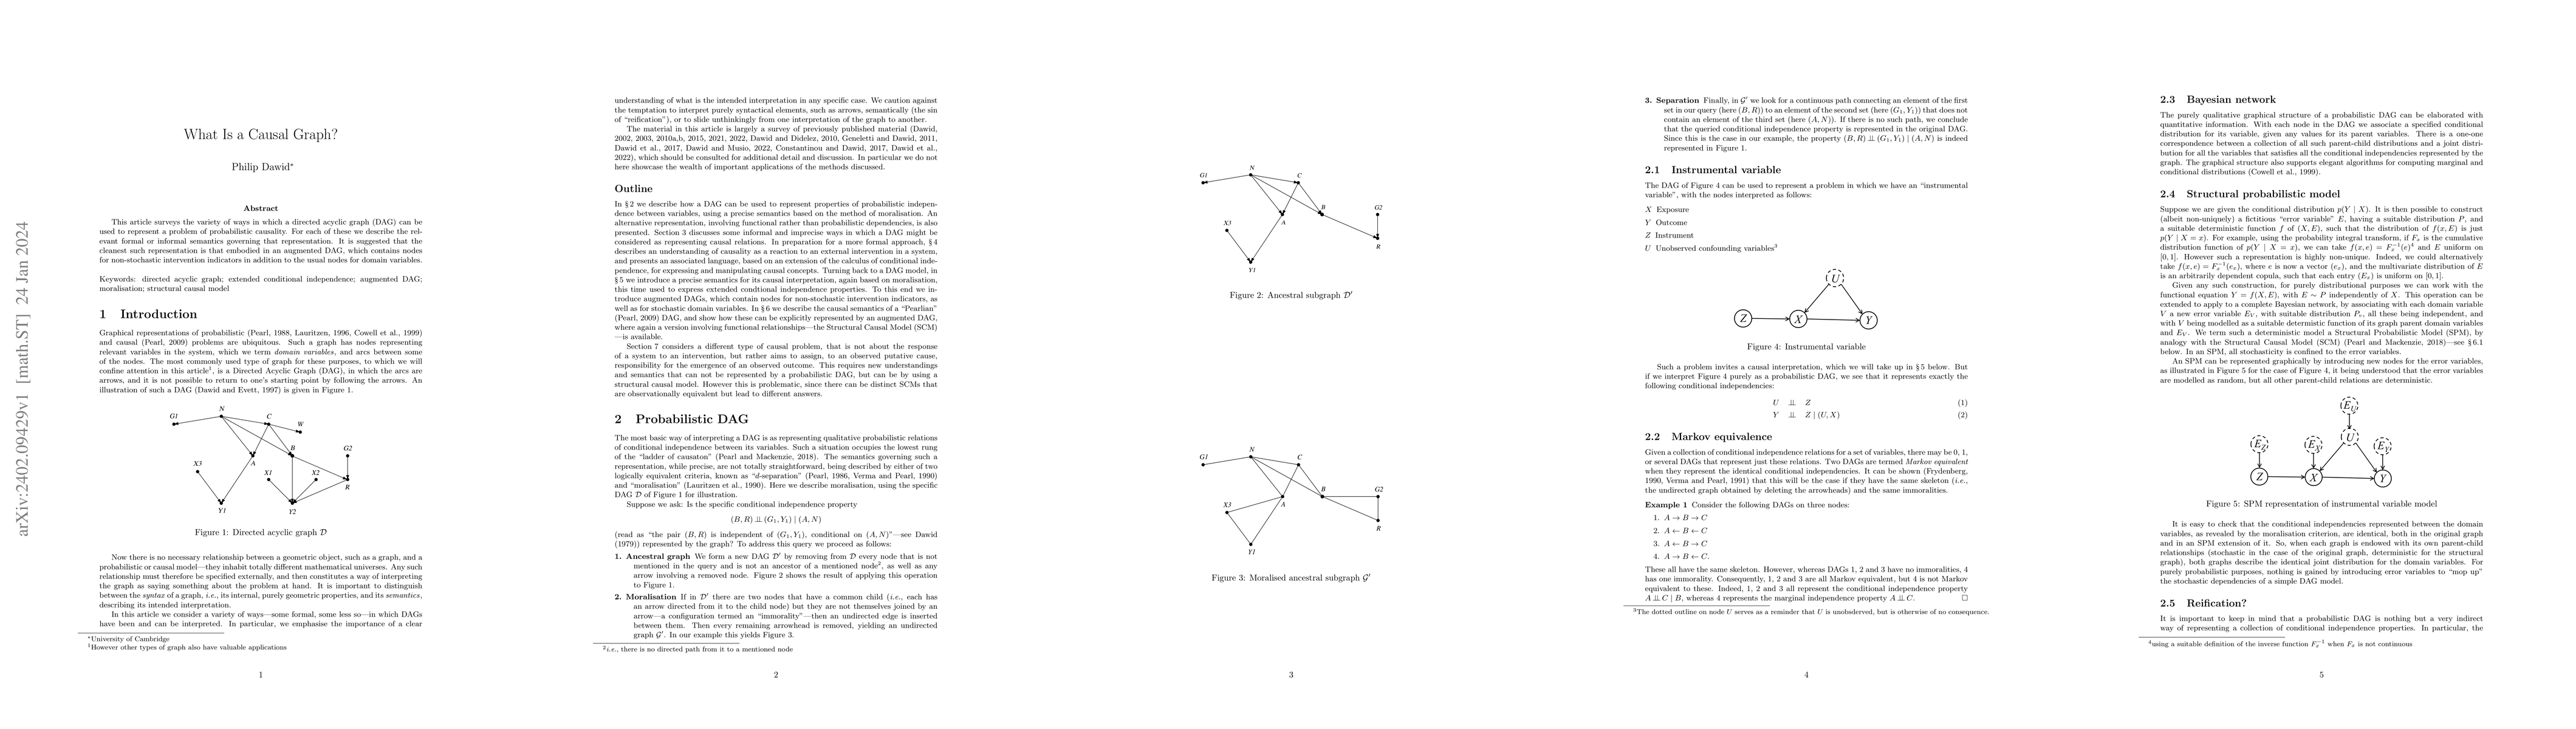
This article surveys the variety of ways in which a directed acyclic graph (DAG) can be used to represent a problem of probabilistic causality. For each of these we describe the relevant formal or informal semantics governing that representation. It is suggested that the cleanest such representation is that embodied in an augmented DAG, which contains nodes for non-stochastic intervention indicators in addition to the usual nodes for domain variables.
AI Key Findings
Get AI-generated insights about this paper's methodology, results, significance, and more — seven facets brought into focus.
Impact
Paper Details
Authors
PDF Preview
Key Terms
Citation Network
Current paper (gray), citations (green), references (blue)
Display is limited for performance on very large graphs.
Discussion 0