Publication
Metrics
AI Quick Summary
The paper proposes an interpretable toolbox for comparing differences between two datasets in various modalities, aiming to explain distribution shifts in a human-understandable way and provide actionable insights to mitigate these differences. The proposed methods outperform existing approaches in explanation quality and correctness.
Paper Preview
Abstract
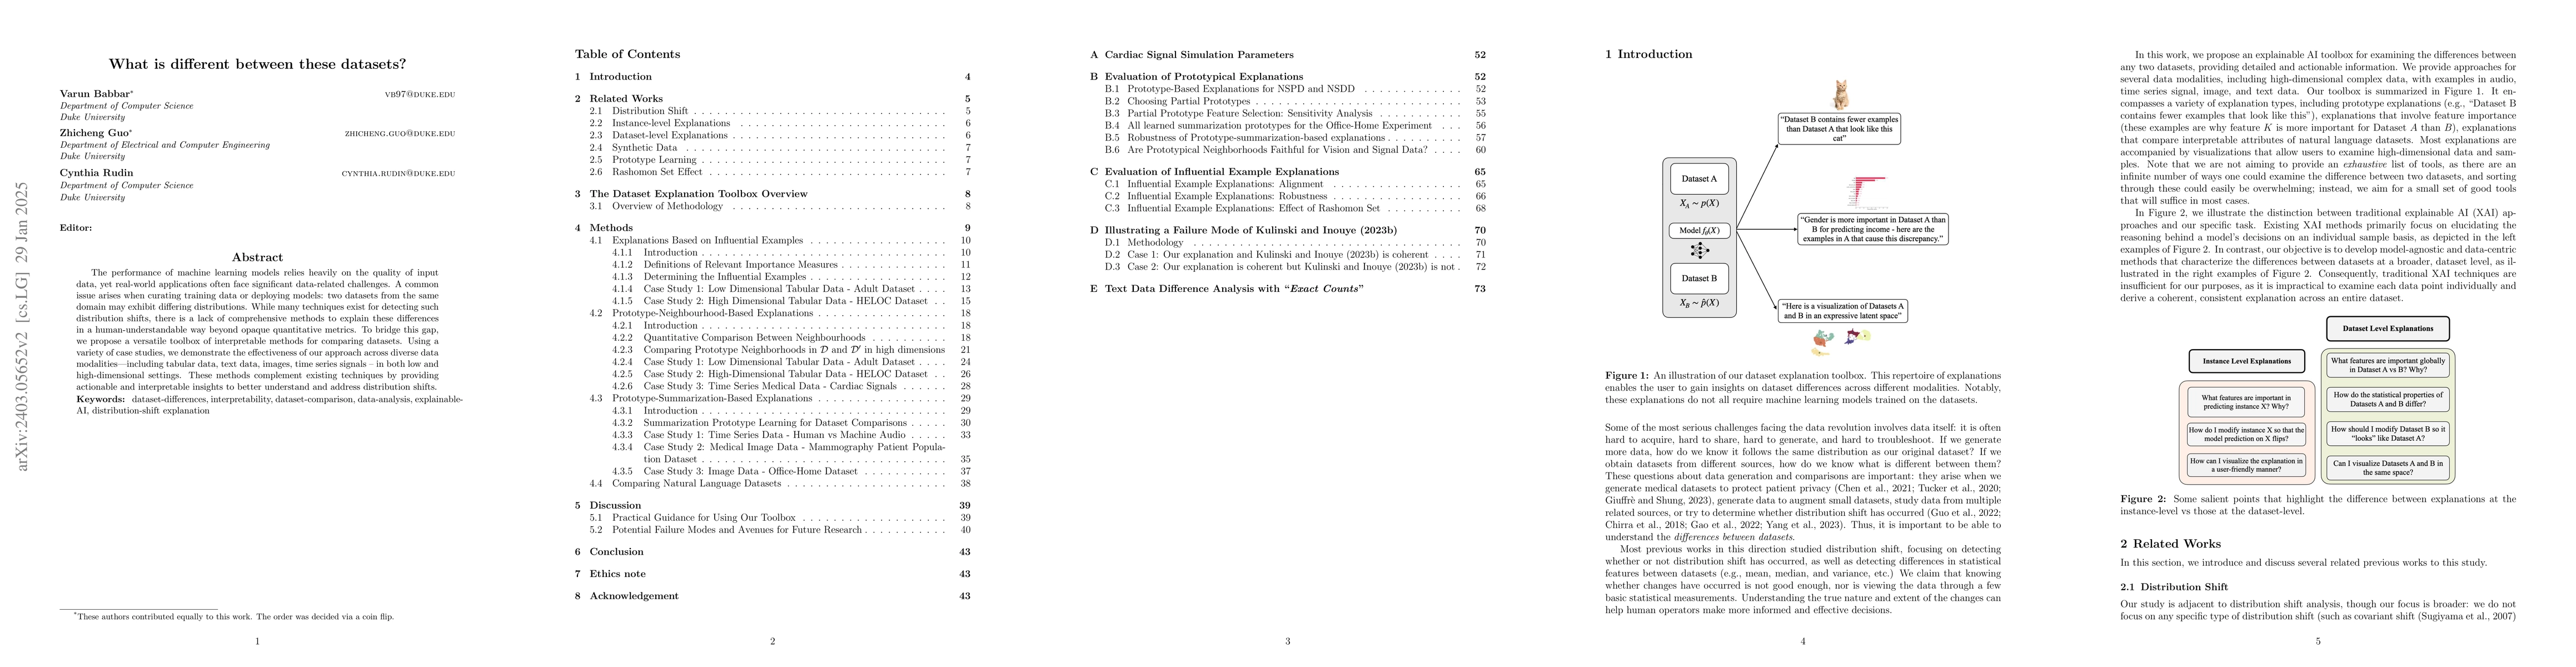
The performance of machine learning models heavily depends on the quality of input data, yet real-world applications often encounter various data-related challenges. One such challenge could arise when curating training data or deploying the model in the real world - two comparable datasets in the same domain may have different distributions. While numerous techniques exist for detecting distribution shifts, the literature lacks comprehensive approaches for explaining dataset differences in a human-understandable manner. To address this gap, we propose a suite of interpretable methods (toolbox) for comparing two datasets. We demonstrate the versatility of our approach across diverse data modalities, including tabular data, language, images, and signals in both low and high-dimensional settings. Our methods not only outperform comparable and related approaches in terms of explanation quality and correctness, but also provide actionable, complementary insights to understand and mitigate dataset differences effectively.
AI Key Findings
Get AI-generated insights about this paper's methodology, results, significance, and more — seven facets brought into focus.
Impact
Paper Details
Authors
PDF Preview
Key Terms
Citation Network
Current paper (gray), citations (green), references (blue)
Display is limited for performance on very large graphs.
Discussion 0