What May Visualization Processes Optimize?
Publication
Metrics
Paper Preview
Abstract
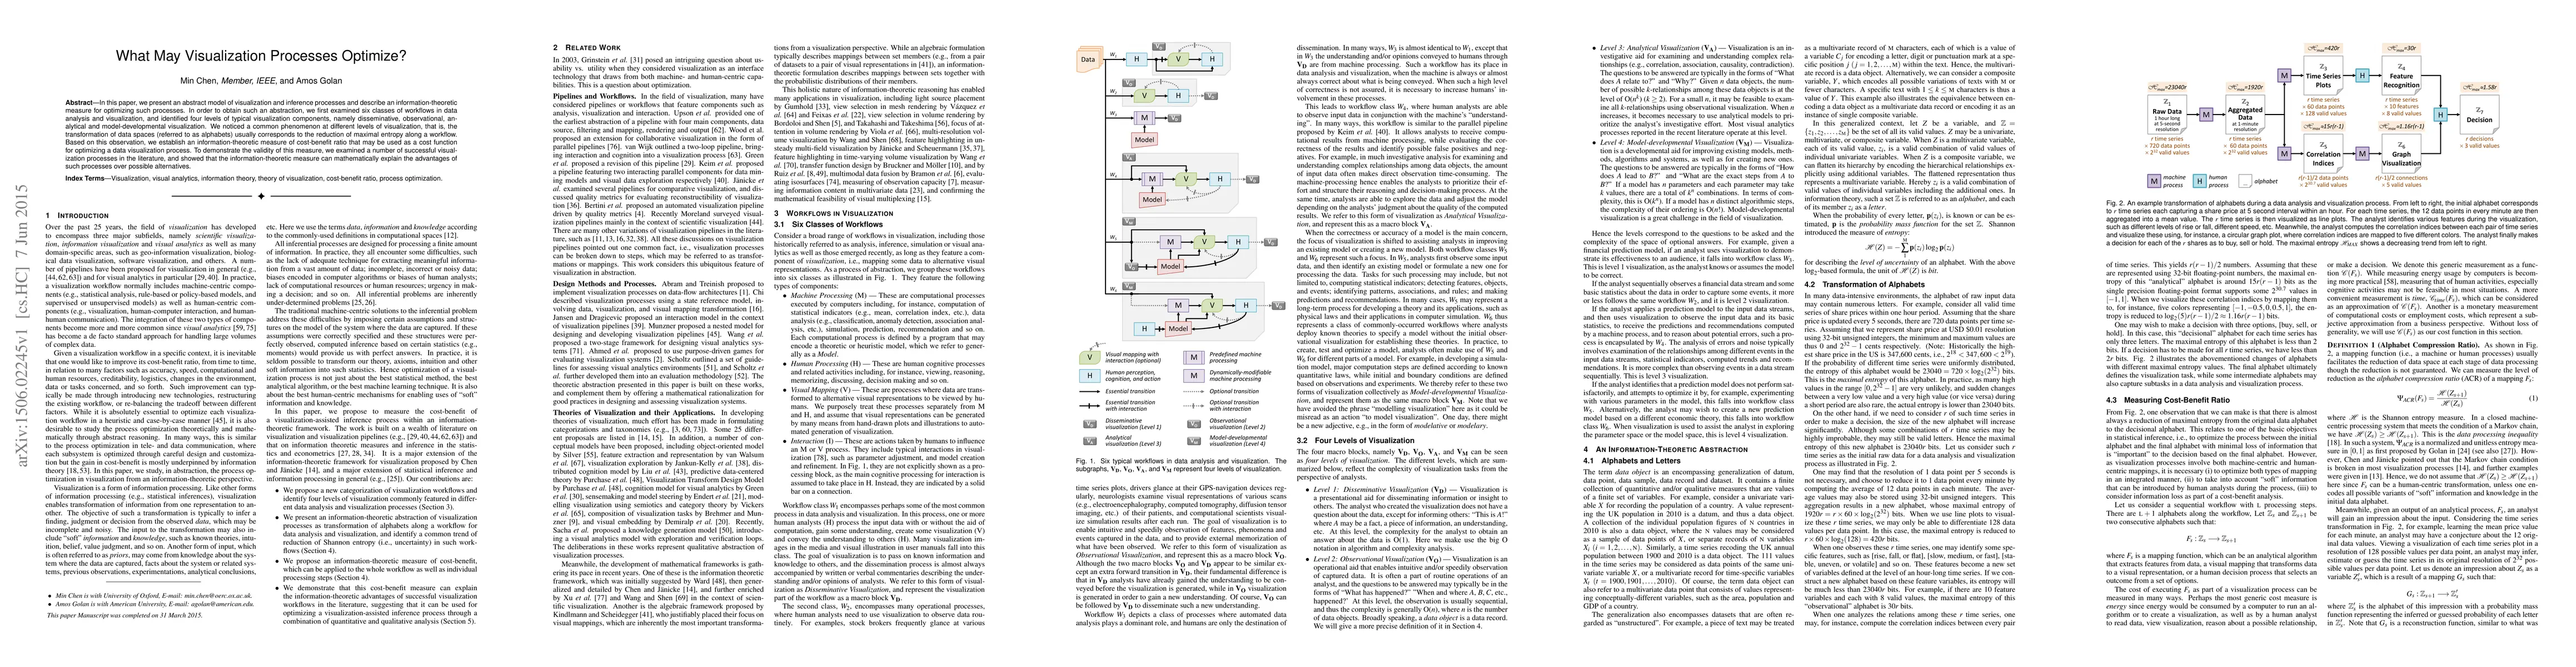
In this paper, we present an abstract model of visualization and inference processes and describe an information-theoretic measure for optimizing such processes. In order to obtain such an abstraction, we first examined six classes of workflows in data analysis and visualization, and identified four levels of typical visualization components, namely disseminative, observational, analytical and model-developmental visualization. We noticed a common phenomenon at different levels of visualization, that is, the transformation of data spaces (referred to as alphabets) usually corresponds to the reduction of maximal entropy along a workflow. Based on this observation, we establish an information-theoretic measure of cost-benefit ratio that may be used as a cost function for optimizing a data visualization process. To demonstrate the validity of this measure, we examined a number of successful visualization processes in the literature, and showed that the information-theoretic measure can mathematically explain the advantages of such processes over possible alternatives.
AI Key Findings
Get AI-generated insights about this paper's methodology, results, significance, and more — seven facets brought into focus.
Impact
Paper Details
PDF Preview
Key Terms
Citation Network
Current paper (gray), citations (green), references (blue)
Display is limited for performance on very large graphs.
Discussion 0