Publication
Metrics
AI Quick Summary
This study investigates how programmers debug their code, revealing that 69.6% of bugs are semantic, while memory and concurrency bugs are less frequent but more time-consuming. Researchers should prioritize fault localization and integrate debugging tools into commonly used IDEs.
Paper Preview
Abstract
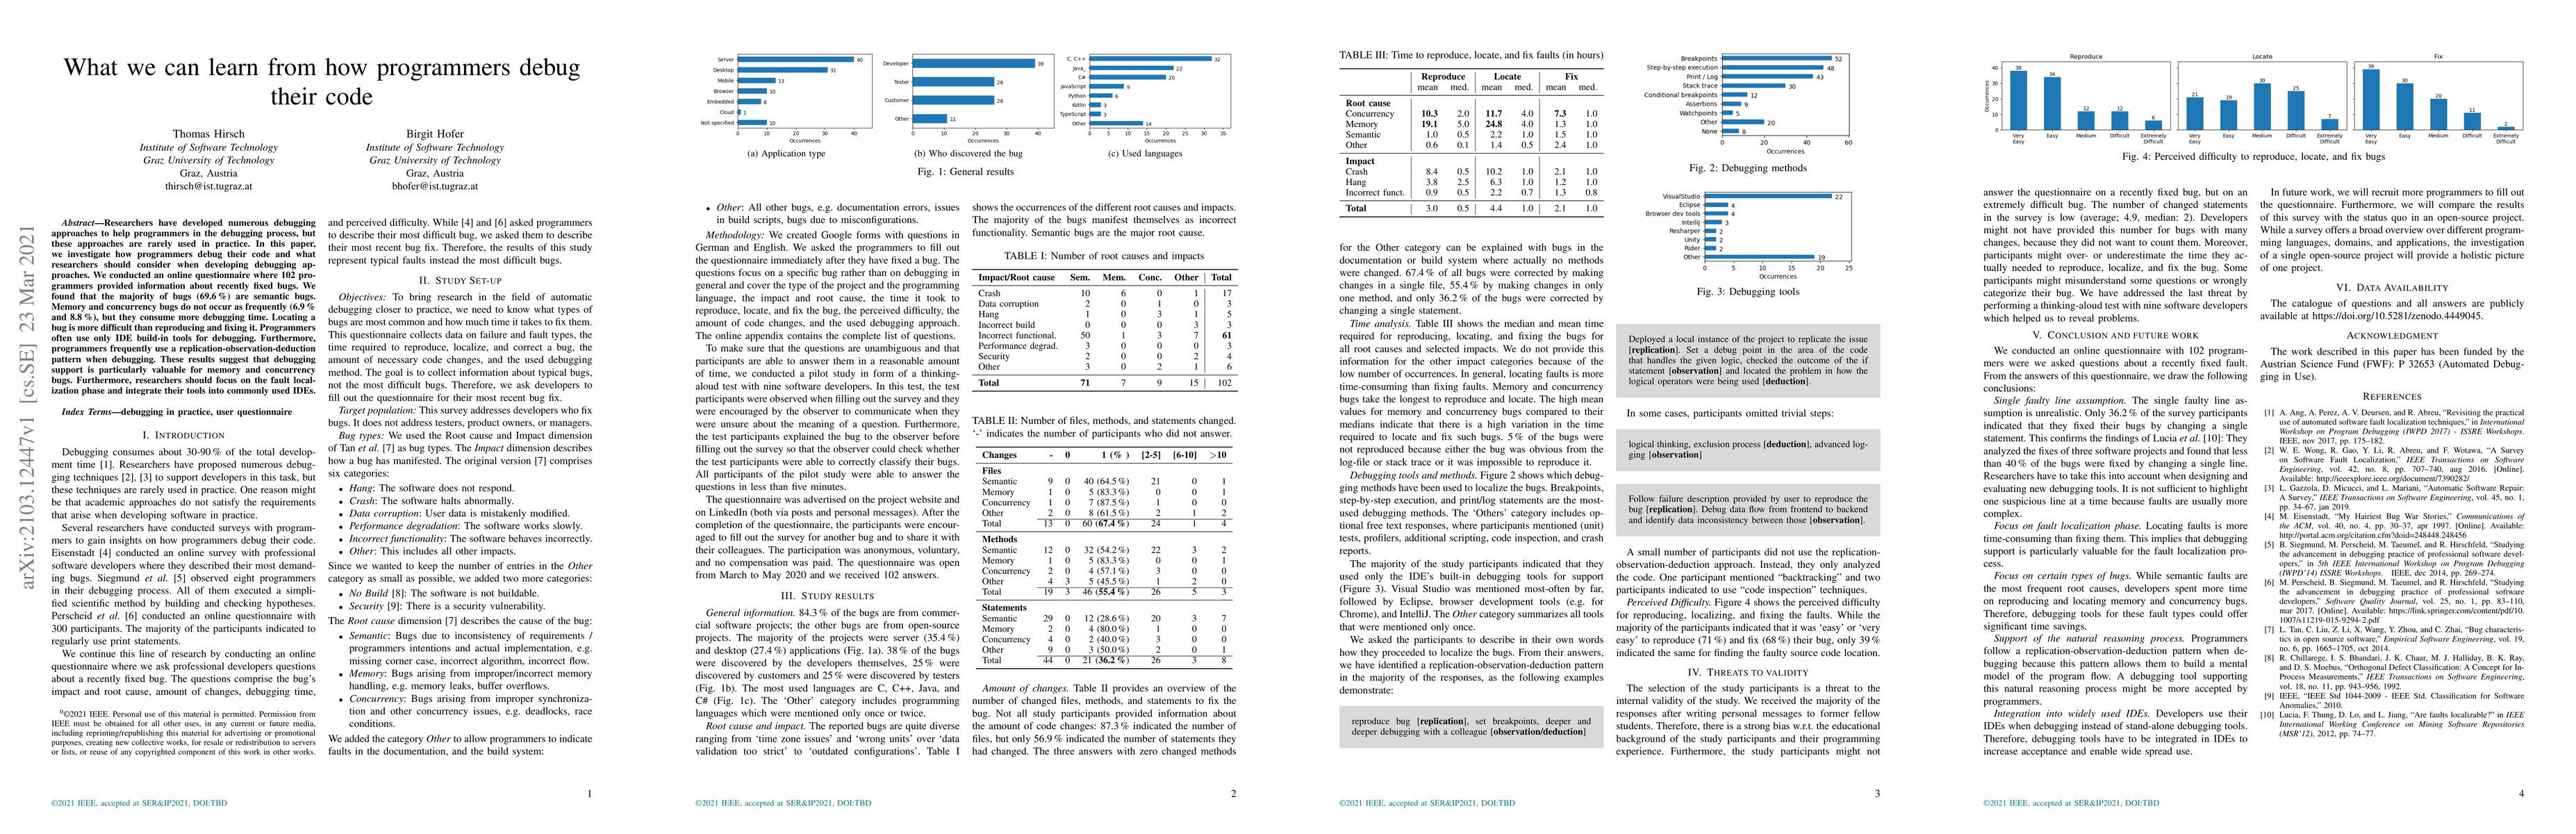
Researchers have developed numerous debugging approaches to help programmers in the debugging process, but these approaches are rarely used in practice. In this paper, we investigate how programmers debug their code and what researchers should consider when developing debugging approaches. We conducted an online questionnaire where 102 programmers provided information about recently fixed bugs. We found that the majority of bugs (69.6 %) are semantic bugs. Memory and concurrency bugs do not occur as frequently (6.9 % and 8.8 %), but they consume more debugging time. Locating a bug is more difficult than reproducing and fixing it. Programmers often use only IDE build-in tools for debugging. Furthermore, programmers frequently use a replication-observation-deduction pattern when debugging. These results suggest that debugging support is particularly valuable for memory and concurrency bugs. Furthermore, researchers should focus on the fault localization phase and integrate their tools into commonly used IDEs.
AI Key Findings
Get AI-generated insights about this paper's methodology, results, significance, and more — seven facets brought into focus.
Impact
Paper Details
Authors
PDF Preview
Key Terms
Citation Network
Current paper (gray), citations (green), references (blue)
Display is limited for performance on very large graphs.
Discussion 0